

SNDL slides over 4% as sellers control price action below key resistance

SNDL Inc. (SNDL) fell 4.1% as technical selling pressure and a lack of a fresh catalyst drove the intraday decline. The down move is supported by SNDL trading below all major moving averages, reinforcing a bearish tone across short- and long-term trends.
 1.36
1.39
Highlights
- SNDL stock trades below key short, medium, and long-term moving averages, underscoring sustained seller pressure.
- Technical indicators are mixed, with bullish MACD momentum but neutral signals from ADX, RSI, and oscillators.
- Expected five-day trading range is $1.26 to $1.36, with a 61% probability of an upward move and consolidation likely.
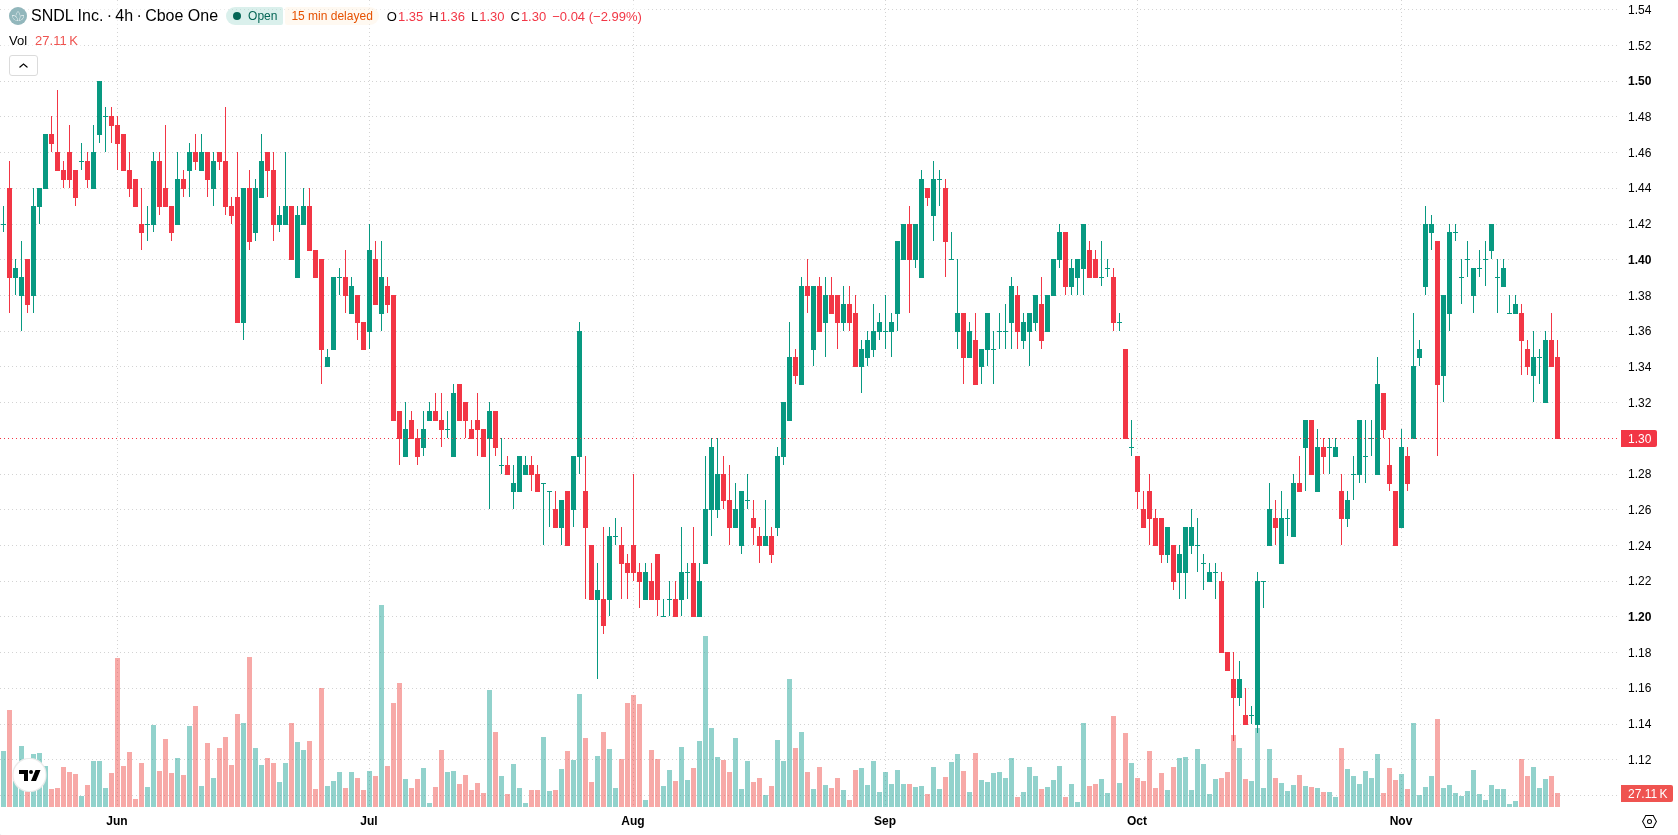
Bearish control persists despite signs of intraday buyer interest
SNDL is trading below its 20-day, 50-day, and 200-day moving averages at $1.29, with those averages at $1.34, $1.32, and $1.38 respectively. Sellers remain in control across all timeframes, with immediate resistance at $1.32 (MA-50) and support at $1.28 (Ichimoku Kijun). MACD shows strong bullish momentum, but the ADX and major oscillators including RSI, Stochastic RSI, and CCI are neutral. Bull/Bear Power is positive, indicating some buyer influence intraday, but volatility remains elevated and sellers have maintained pressure since the open.
Previously it was reported that SNDL was under persistent bearish momentum with limited prospects for an immediate upside reversal. The latest technical developments confirm this broader weakness, suggesting traders monitor $1.26 as the key downside level while volatility keeps the risk of further price swings elevated.








-
 Afghanistan
-
 Albania
-
 Algeria
-
 Angola
-
 Argentina
-
 Armenia
-
 Australia
-
 Austria
-
 Azerbaijan
-
 Bahamas
-
 Bahrain
-
 Bangladesh
-
 Belarus
-
 Belgium
-
 Bolivia
-
 Botswana
-
 Brazil
-
 Brunei
-
 Bulgaria
-
 Cambodia
-
 Cameroon
-
 Canada
-
 Chile
-
 China
-
 Colombia
-
 Congo
-
 Costa Rica
-
 Cote d'Ivoire
-
 Croatia
-
 Cuba
-
 Cyprus
-
 Czechia
-
 DR Congo
-
 Denmark
-
 Dominican Republic
-
 Ecuador
-
 Egypt
-
 El Salvador
-
 Estonia
-
 Eswatini
-
 Ethiopia
-
 Finland
-
 France
-
 Georgia
-
 Germany
-
 Ghana
-
 Greece
-
 Haiti
-
 Hong Kong
-
 Hungary
-
 India
-
 Indonesia
-
 Iran, Islamic republic
-
 Iraq
-
 Ireland
-
 Israel
-
 Italy
-
 Jamaica
-
 Japan
-
 Jordan
-
 Kazakhstan
-
 Kenya
-
 Korea
-
 Kuwait
-
 Kyrgyzstan
-
 Laos
-
 Latvia
-
 Lebanon
-
 Lesotho
-
 Libya
-
 Lithuania
-
 Luxembourg
-
 Madagascar
-
 Malaysia
-
 Malta
-
 Mauritius
-
 Mexico
-
 Moldova
-
 Mongolia
-
 Montenegro
-
 Morocco
-
 Mozambique
-
 Myanmar
-
 Namibia
-
 Nepal
-
 Netherlands
-
 New Zealand
-
 Nigeria
-
 North Macedonia
-
 Norway
-
 Oman
-
 Pakistan
-
 Palestine
-
 Panama
-
 Papua New Guinea
-
 Paraguay
-
 Peru
-
 Philippines
-
 Poland
-
 Portugal
-
 Puerto Rico
-
 Qatar
-
 Reunion
-
 Romania
-
 Rwanda
-
 Saudi Arabia
-
 Serbia
-
 Singapore
-
 Slovakia
-
 Slovenia
-
 Somalia
-
 South Africa
-
 Spain
-
 Sri Lanka
-
 Sweden
-
 Switzerland
-
 Syria
-
 Taiwan
-
 Tajikistan
-
 Tanzania
-
 Thailand
-
 Trinidad and Tobago
-
 Tunisia
-
 Turkey
-
 UAE
-
 Uganda
-
 Ukraine
-
 United Kingdom
-
United States
-
 Uruguay
-
 Uzbekistan
-
 Venezuela
-
 Vietnam
-
 Yemen
-
 Zambia
-
 Zimbabwe
- Forex
- Crypto












