

S&P 500 prediction: Downward pressure persists as sellers control the near-term trend

S&P 500 (SPX) is trading at 7,069, marking a daily loss of 1.5%. The index remains below its key moving averages, reflecting sustained downward momentum.
 7198.67
7515.60
Highlights
- The S&P 500 has fallen for six consecutive sessions, its longest losing streak since April 2024.
- The index is trading below its 200-day moving average for a third straight session, a pattern seldom observed since 2005.
- Technical indicators confirm persistent selling pressure with weak momentum, suggesting a trading range of 6,993 to 7,146 and a low probability of a near-term upside reversal.
Longest losing streak since April as tech volatility drives selloff
The S&P 500 has recorded six straight daily declines, marking its longest losing streak since April 2024 and highlighting sustained broad-based selling pressure. According to Seeking Alpha, the index is set to close below its 200-day moving average for the third consecutive day, an occurrence rarely seen since 2005, which has contributed to deteriorating investor confidence. The latest selloff has been accelerated by heightened volatility in the technology sector, triggered in part by Anthropic's record IPO, magnifying losses across the broader market.
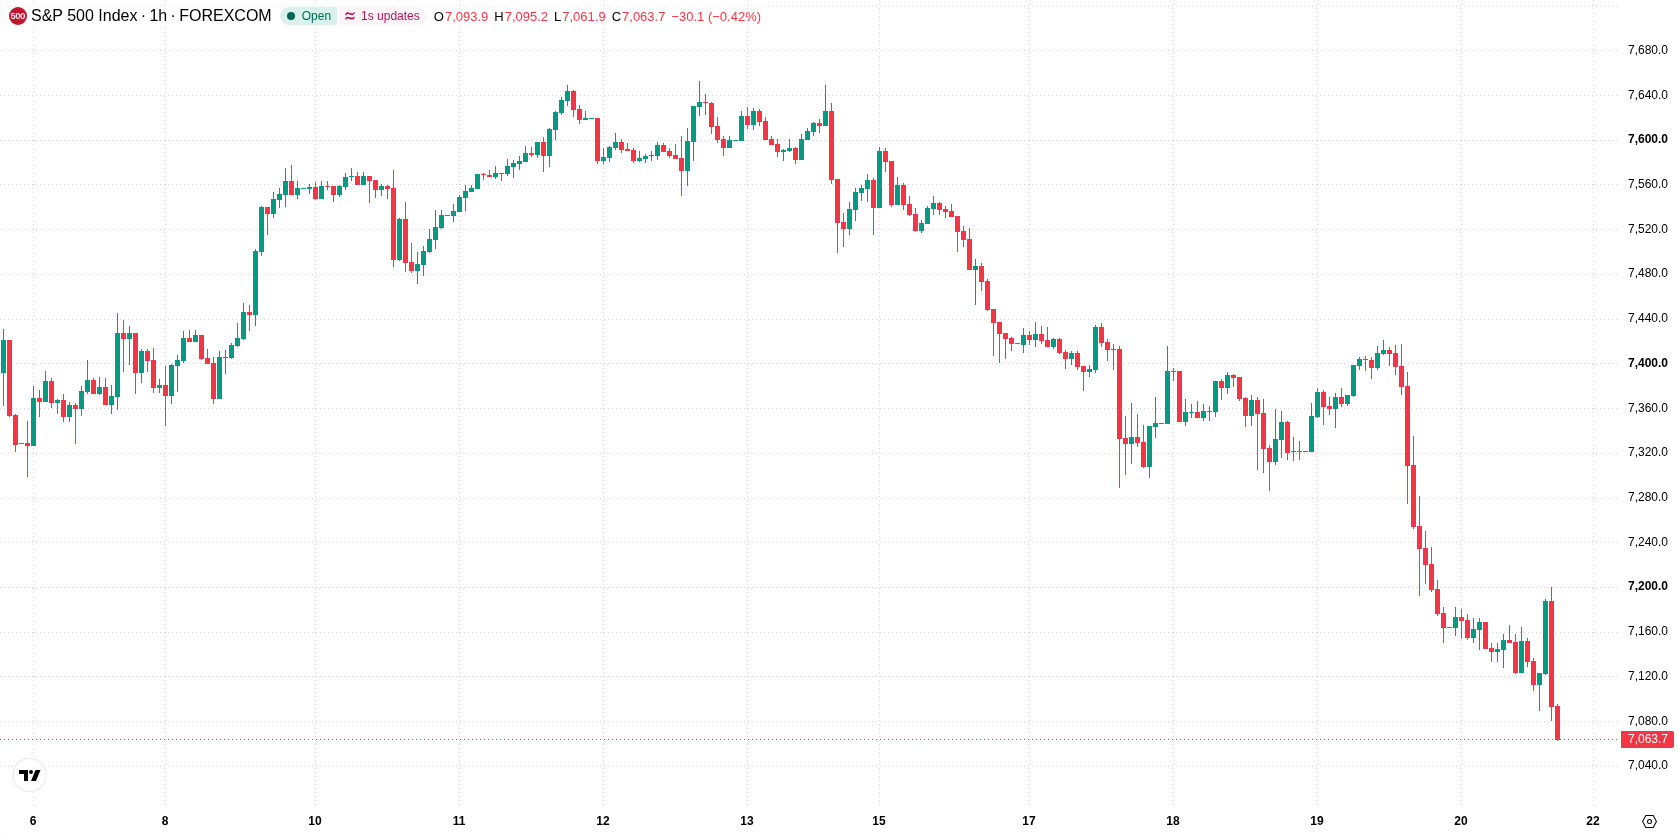
Oversold technicals and strong selling pressure restrict rebound potential
SPX/USD price is currently below the H1 SMA-20 at 7,302, H1 SMA-50 at 7,440, and the D1 SMA-200 at 7,348. Immediate resistance is set by the Ichimoku Kijun at 7,306. Momentum indicators, including MACD and ADX, indicate persistent selling pressure. RSI, Stoch RSI, and CCI are all within their respective oversold ranges, implying potential for a short-term technical rebound. Bull/Bear Power stands deeply negative at -72.19, while the Awesome Oscillator continues to reinforce the prevailing negative tone.
Elevated downside risk as upside prospects remain limited
In the short term, SPX is expected to trade between 6,993 and 7,146, reflecting the current volatility band relative to existing levels. The likelihood of an upside move is considered very low, whereas downside risk remains elevated. This suggests a baseline scenario of consolidation within the stated range. A decisive drop below immediate support may confirm further declines, while a break above resistance at 7,306 would be required to consider a bullish scenario.
Earlier, analysts noted that ongoing artificial intelligence investment and steady earnings growth were expected to provide support for U.S. equities over the medium term. The recent pronounced selling pressure and persistent break below key moving averages introduce notable downside risk, making further violations of immediate support levels a crucial focus for traders in the near term.











-
 Afghanistan
-
 Albania
-
 Algeria
-
 Angola
-
 Argentina
-
 Armenia
-
 Australia
-
 Austria
-
 Azerbaijan
-
 Bahamas
-
 Bahrain
-
 Bangladesh
-
 Belarus
-
 Belgium
-
 Bolivia
-
 Botswana
-
 Brazil
-
 Brunei
-
 Bulgaria
-
 Cambodia
-
 Cameroon
-
 Canada
-
 Chile
-
 China
-
 Colombia
-
 Congo
-
 Costa Rica
-
 Cote d'Ivoire
-
 Croatia
-
 Cuba
-
 Cyprus
-
 Czechia
-
 DR Congo
-
 Denmark
-
 Dominican Republic
-
 Ecuador
-
 Egypt
-
 El Salvador
-
 Estonia
-
 Eswatini
-
 Ethiopia
-
 Finland
-
 France
-
 Georgia
-
 Germany
-
 Ghana
-
 Greece
-
 Haiti
-
 Hong Kong
-
 Hungary
-
 India
-
 Indonesia
-
 Iran, Islamic republic
-
 Iraq
-
 Ireland
-
 Israel
-
 Italy
-
 Jamaica
-
 Japan
-
 Jordan
-
 Kazakhstan
-
 Kenya
-
 Korea
-
 Kuwait
-
 Kyrgyzstan
-
 Laos
-
 Latvia
-
 Lebanon
-
 Lesotho
-
 Libya
-
 Lithuania
-
 Luxembourg
-
 Madagascar
-
 Malaysia
-
 Malta
-
 Mauritius
-
 Mexico
-
 Moldova
-
 Mongolia
-
 Montenegro
-
 Morocco
-
 Mozambique
-
 Myanmar
-
 Namibia
-
 Nepal
-
 Netherlands
-
 New Zealand
-
 Nigeria
-
 North Macedonia
-
 Norway
-
 Oman
-
 Pakistan
-
 Palestine
-
 Panama
-
 Papua New Guinea
-
 Paraguay
-
 Peru
-
 Philippines
-
 Poland
-
 Portugal
-
 Puerto Rico
-
 Qatar
-
 Reunion
-
 Romania
-
 Rwanda
-
 Saudi Arabia
-
 Serbia
-
 Singapore
-
 Slovakia
-
 Slovenia
-
 Somalia
-
 South Africa
-
 Spain
-
 Sri Lanka
-
 Sweden
-
 Switzerland
-
 Syria
-
 Taiwan
-
 Tajikistan
-
 Tanzania
-
 Thailand
-
 Trinidad and Tobago
-
 Tunisia
-
 Turkey
-
 UAE
-
 Uganda
-
 Ukraine
-
 United Kingdom
-
United States
-
 Uruguay
-
 Uzbekistan
-
 Venezuela
-
 Vietnam
-
 Yemen
-
 Zambia
-
 Zimbabwe
- Forex
- Crypto












