

Over 2% drop for S&P 500 as technical selling accelerates below moving averages

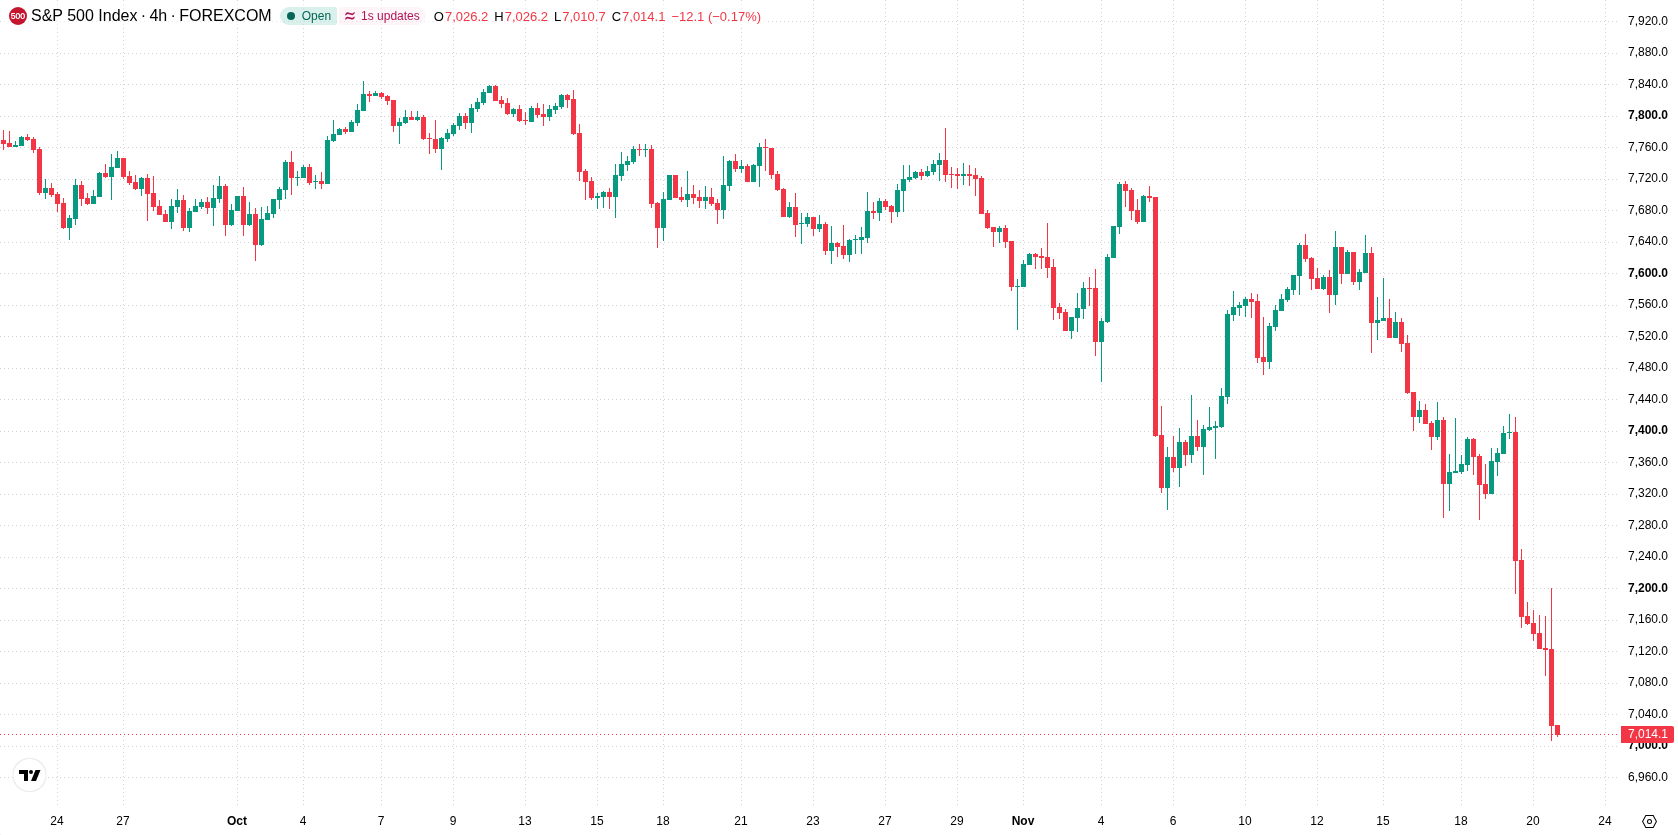
S&P 500 Index (SPX) fell 2.3% as mounting concerns about interest rate hikes and macroeconomic uncertainty drove renewed selling, with the market entering correction territory after technology-led declines and recent volatility events. The move is supported by technical signals, as SPX remains below all major moving averages and faces heavy downside pressure near key support levels.
 7198.67
7515.60
Highlights
- The S&P 500 has entered correction territory, falling over 10% from its October all-time highs amid economic uncertainty.
- Elevated volatility and sustained selling have driven the longest losing streak since 2024, with technology stocks particularly weak.
- The index is trading below key moving averages with technical signals bearish and a projected five-day range of 6,830 to 7,181.
Extended losing streak as technology stocks and volatility events weigh
The S&P 500 has entered correction territory, declining over 10% from its October all-time highs and marking its longest losing streak since 2024 with six straight sessions of losses. Market volatility has been elevated, particularly following the biggest single-day reversal since March 2020, influenced by investor concerns over potential interest rate hikes and broader economic uncertainty. Losses among technology shares following events like the Anthropic IPO have also contributed, accompanied by a retreat in volatility indexes, though price action has remained under broader selling pressure.
Bearish signals intensify with downside momentum and mixed oscillators
The S&P 500 is trading below its 20-day ($7,534), 50-day ($7,640), and 200-day ($7,348) moving averages, reflecting downside momentum across all timeframes. Resistance stands at $7,032, matching today's low, with support at $6,830. Momentum indicators point to further weakness, as the MACD issues a Sell signal and the ADX is neutral at 19.9, indicating a weak trend. The RSI is neutral, while both the Stochastic RSI and CCI are in the oversold zone, which raises a potential for short-term rebound. The BBP remains negative, showing sellers dominate intraday, and the Awesome Oscillator supports the bearish tone. The session saw a downside gap of about 0.35% with high intraday volatility at 2.36%. Sellers are firmly in control with price action heavy toward the session’s lows.
In a recent review, analysts noted that sector rotation was gaining momentum as technology stocks lost leadership and other areas like healthcare and financials became more prominent contributors to market performance. The current technical backdrop, marked by downside momentum and a high probability of continued weakness, underlines the need to monitor the $6,830 support as a trigger for additional downside risk in the S&P 500.






Latest S&P 500 News



-
 Afghanistan
-
 Albania
-
 Algeria
-
 Angola
-
 Argentina
-
 Armenia
-
 Australia
-
 Austria
-
 Azerbaijan
-
 Bahamas
-
 Bahrain
-
 Bangladesh
-
 Belarus
-
 Belgium
-
 Bolivia
-
 Botswana
-
 Brazil
-
 Brunei
-
 Bulgaria
-
 Cambodia
-
 Cameroon
-
 Canada
-
 Chile
-
 China
-
 Colombia
-
 Congo
-
 Costa Rica
-
 Cote d'Ivoire
-
 Croatia
-
 Cuba
-
 Cyprus
-
 Czechia
-
 DR Congo
-
 Denmark
-
 Dominican Republic
-
 Ecuador
-
 Egypt
-
 El Salvador
-
 Estonia
-
 Eswatini
-
 Ethiopia
-
 Finland
-
 France
-
 Georgia
-
 Germany
-
 Ghana
-
 Greece
-
 Haiti
-
 Hong Kong
-
 Hungary
-
 India
-
 Indonesia
-
 Iran, Islamic republic
-
 Iraq
-
 Ireland
-
 Israel
-
 Italy
-
 Jamaica
-
 Japan
-
 Jordan
-
 Kazakhstan
-
 Kenya
-
 Korea
-
 Kuwait
-
 Kyrgyzstan
-
 Laos
-
 Latvia
-
 Lebanon
-
 Lesotho
-
 Libya
-
 Lithuania
-
 Luxembourg
-
 Madagascar
-
 Malaysia
-
 Malta
-
 Mauritius
-
 Mexico
-
 Moldova
-
 Mongolia
-
 Montenegro
-
 Morocco
-
 Mozambique
-
 Myanmar
-
 Namibia
-
 Nepal
-
 Netherlands
-
 New Zealand
-
 Nigeria
-
 North Macedonia
-
 Norway
-
 Oman
-
 Pakistan
-
 Palestine
-
 Panama
-
 Papua New Guinea
-
 Paraguay
-
 Peru
-
 Philippines
-
 Poland
-
 Portugal
-
 Puerto Rico
-
 Qatar
-
 Reunion
-
 Romania
-
 Rwanda
-
 Saudi Arabia
-
 Serbia
-
 Singapore
-
 Slovakia
-
 Slovenia
-
 Somalia
-
 South Africa
-
 Spain
-
 Sri Lanka
-
 Sweden
-
 Switzerland
-
 Syria
-
 Taiwan
-
 Tajikistan
-
 Tanzania
-
 Thailand
-
 Trinidad and Tobago
-
 Tunisia
-
 Turkey
-
 UAE
-
 Uganda
-
 Ukraine
-
 United Kingdom
-
United States
-
 Uruguay
-
 Uzbekistan
-
 Venezuela
-
 Vietnam
-
 Yemen
-
 Zambia
-
 Zimbabwe
- Forex
- Crypto












