


SNDL Inc. (SNDL) fell 3.23% as persistent technical weakness and broad selling pressure defined today's move. The downtrend is reinforced by the stock remaining below all key moving averages, which continues to support the bearish tone.
 1.25
1.38
Highlights
- Shares of SNDL last traded at $1.2, down 3.23%, remaining below key moving averages and pressured across all timeframes.
- Momentum indicators are mixed with a positive MACD but weak trend strength and some signs of selling exhaustion in oversold oscillators.
- SNDL is expected to trade between $1.13 and $1.27 over the next five days, with a 76% probability of a downward move.
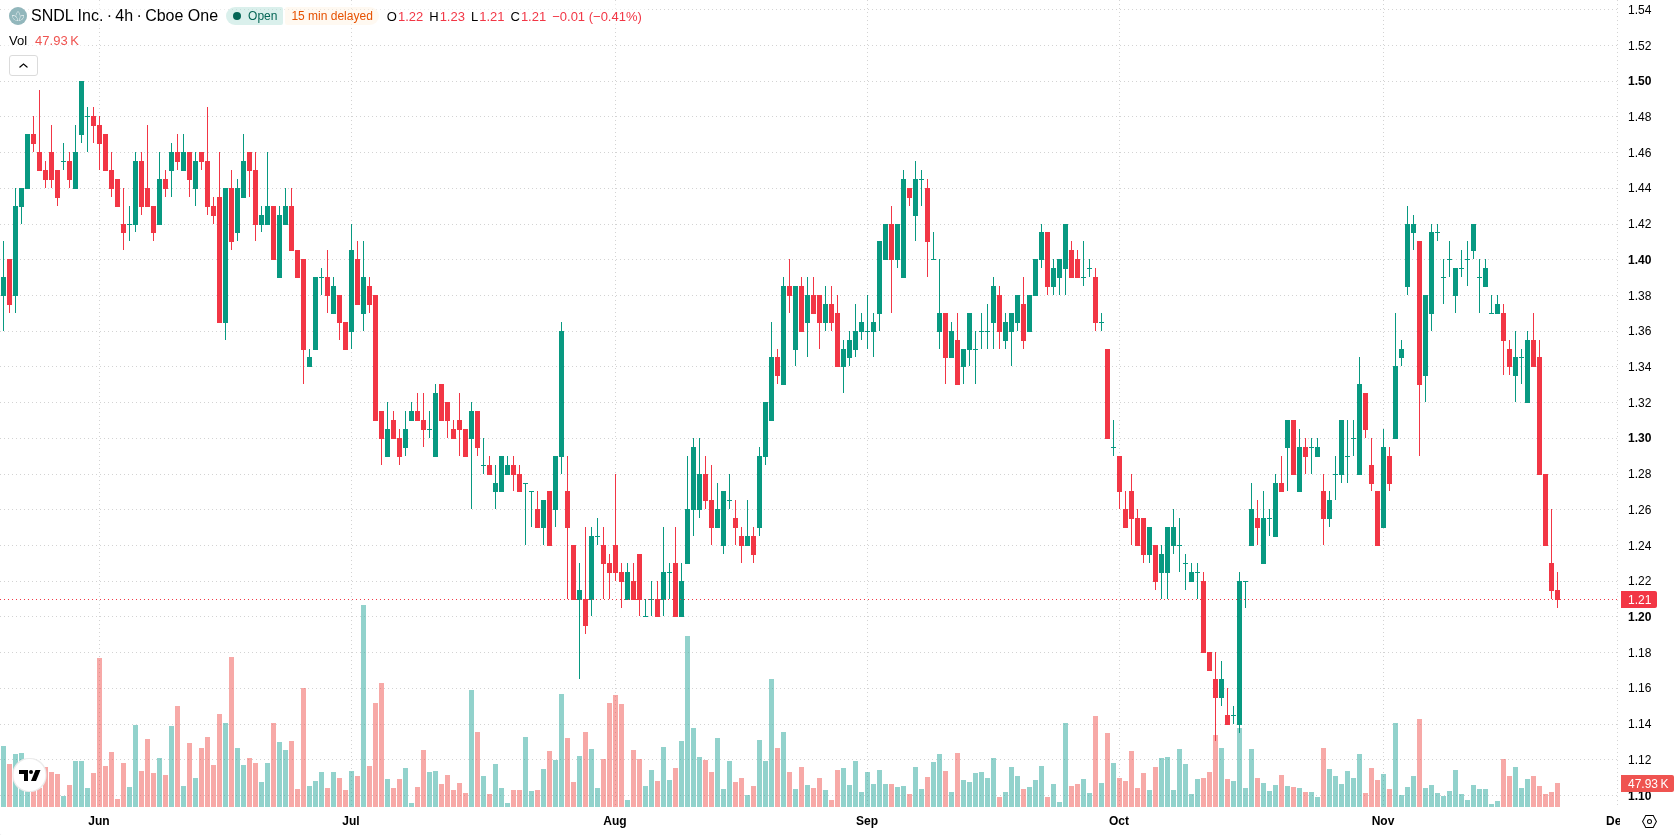
Mixed momentum and weak trend as all averages remain breached
SNDL is trading below its 20-day, 50-day, and 200-day moving averages, which stand at $1.34, $1.32, and $1.38, respectively. This indicates sustained selling pressure across all timeframes. Immediate resistance is identified at $1.21, while support sits at $1.13. The long-term trend remains bearish as the MA-50 is below the MA-200. Momentum signals are mixed: MACD is positive and suggests buy conviction, but ADX is low at 12.83, pointing to a neutral trend strength. Oscillators such as RSI and CCI are neutral, while Stochastic RSI is in the oversold zone, which may signal potential selling exhaustion or a possible rebound. Bull/Bear Power is marginally positive, reflecting slight intraday buyer dominance. The price last traded at $1.20, near the day's low, after opening with a downside gap and showing 3.31% intraday volatility. Overall, daily indicators and price action continue to point to weakness.
Previously it was reported that SNDL continued to exhibit persistent bearish momentum with little sign of a near-term reversal. The latest technical signals suggest that this bearish trend remains intact, and traders should monitor the $1.13 support level for potential downside risk in the coming sessions.









-
 Afghanistan
-
 Albania
-
 Algeria
-
 Angola
-
 Argentina
-
 Armenia
-
 Australia
-
 Austria
-
 Azerbaijan
-
 Bahamas
-
 Bahrain
-
 Bangladesh
-
 Belarus
-
 Belgium
-
 Bolivia
-
 Botswana
-
 Brazil
-
 Brunei
-
 Bulgaria
-
 Cambodia
-
 Cameroon
-
 Canada
-
 Chile
-
 China
-
 Colombia
-
 Congo
-
 Costa Rica
-
 Cote d'Ivoire
-
 Croatia
-
 Cuba
-
 Cyprus
-
 Czechia
-
 DR Congo
-
 Denmark
-
 Dominican Republic
-
 Ecuador
-
 Egypt
-
 El Salvador
-
 Estonia
-
 Eswatini
-
 Ethiopia
-
 Finland
-
 France
-
 Georgia
-
 Germany
-
 Ghana
-
 Greece
-
 Haiti
-
 Hong Kong
-
 Hungary
-
 India
-
 Indonesia
-
 Iran, Islamic republic
-
 Iraq
-
 Ireland
-
 Israel
-
 Italy
-
 Jamaica
-
 Japan
-
 Jordan
-
 Kazakhstan
-
 Kenya
-
 Korea
-
 Kuwait
-
 Kyrgyzstan
-
 Laos
-
 Latvia
-
 Lebanon
-
 Lesotho
-
 Libya
-
 Lithuania
-
 Luxembourg
-
 Madagascar
-
 Malaysia
-
 Malta
-
 Mauritius
-
 Mexico
-
 Moldova
-
 Mongolia
-
 Montenegro
-
 Morocco
-
 Mozambique
-
 Myanmar
-
 Namibia
-
 Nepal
-
 Netherlands
-
 New Zealand
-
 Nigeria
-
 North Macedonia
-
 Norway
-
 Oman
-
 Pakistan
-
 Palestine
-
 Panama
-
 Papua New Guinea
-
 Paraguay
-
 Peru
-
 Philippines
-
 Poland
-
 Portugal
-
 Puerto Rico
-
 Qatar
-
 Reunion
-
 Romania
-
 Rwanda
-
 Saudi Arabia
-
 Serbia
-
 Singapore
-
 Slovakia
-
 Slovenia
-
 Somalia
-
 South Africa
-
 Spain
-
 Sri Lanka
-
 Sweden
-
 Switzerland
-
 Syria
-
 Taiwan
-
 Tajikistan
-
 Tanzania
-
 Thailand
-
 Trinidad and Tobago
-
 Tunisia
-
 Turkey
-
 UAE
-
 Uganda
-
 Ukraine
-
 United Kingdom
-
United States
-
 Uruguay
-
 Uzbekistan
-
 Venezuela
-
 Vietnam
-
 Yemen
-
 Zambia
-
 Zimbabwe
- Forex
- Crypto












