


Walmart Inc. (WMT) climbed 2.2% after the company delivered strong third-quarter fiscal 2027 results that topped both revenue and earnings expectations, driven by robust digital and advertising gains. The move is supported by Walmart trading above all major moving averages, though the longer-term trend remains bearish due to the distant alignment of the 50-day and 200-day averages.
 129.69
129.84
Highlights
- Walmart reported a 5.2% revenue increase and beat estimates for both earnings and sales in its third quarter fiscal 2027 update.
- U.S. online sales grew by 23% and global advertising sales rose by 25%, as the company boosted investment in e-commerce and AI-driven initiatives.
- Shares of Walmart trade with bullish momentum above key averages, with an expected five-session range of $125.59 to $133.36 and a 67% probability of upward movement.
Digital gains and AI tools boost outlook and investor positioning
Walmart reported third-quarter fiscal 2027 results that exceeded revenue and earnings estimates, with a 5.2% increase in revenue fueled by digital and e-commerce growth. U.S. online sales rose by 23% and global advertising revenue advanced by 25%, reflecting the impact of recent AI tools and connected TV initiatives. The company raised its fiscal 2027 sales and profit outlook, highlighted ongoing membership expansion, and continued to invest in digital-driven strategies.
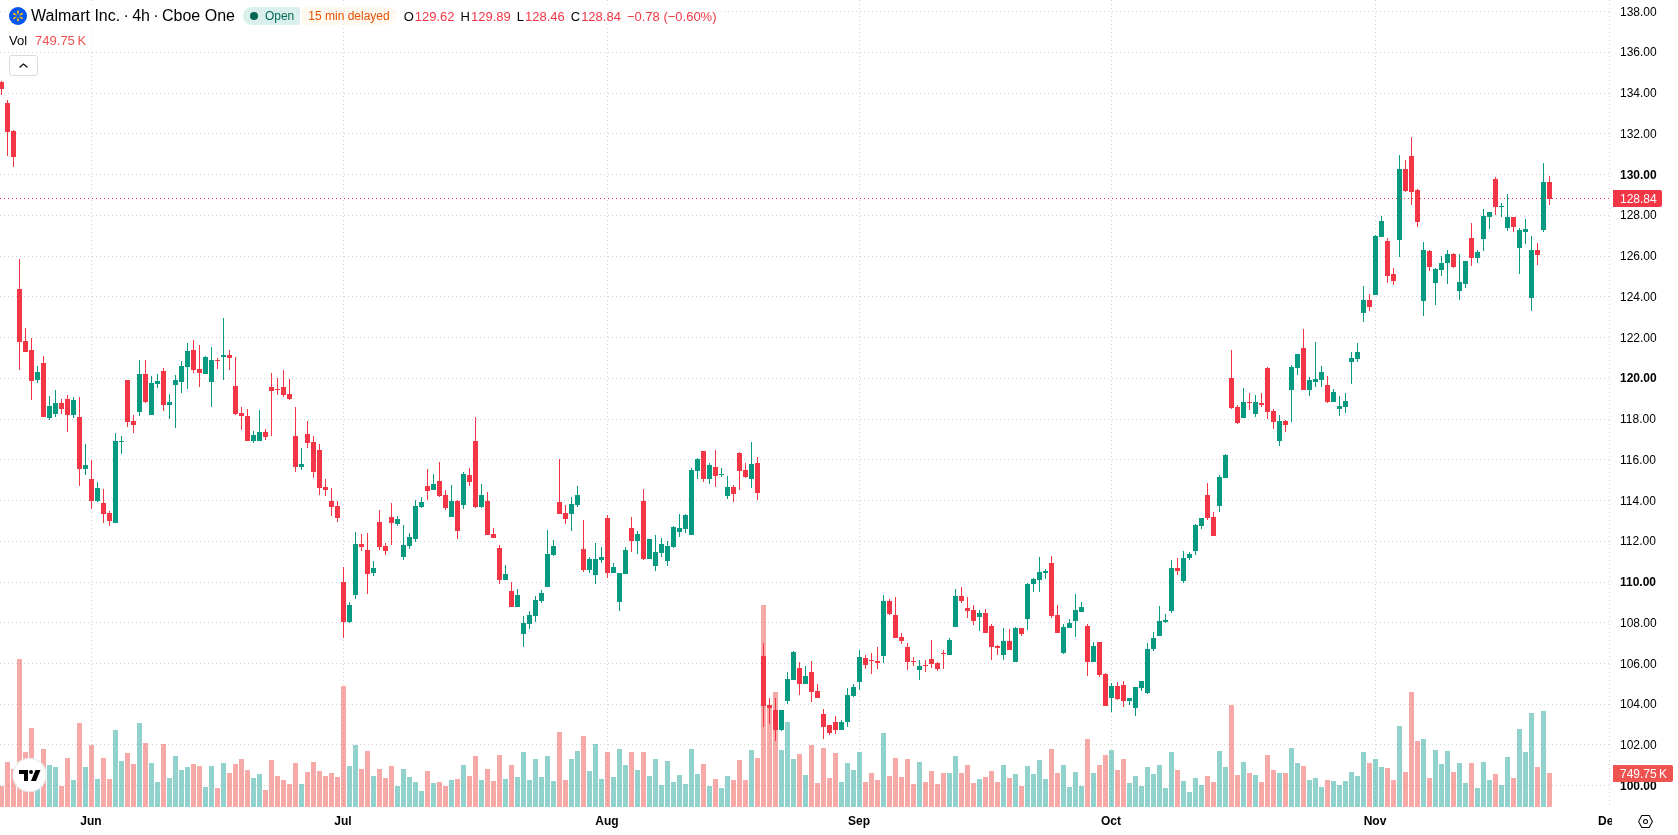
Short-term momentum builds despite bearish long-term alignment
Walmart is trading above its 20-day ($124.92), 50-day ($116.22), and 200-day ($118.98) moving averages, reflecting bullish momentum over the short, medium, and long term. The near-term resistance stands at $129.69, with support at $127.24. Despite the upward alignment, the distant positioning of the 50-day and 200-day moving averages still labels the longer-term trend as bearish. The MACD indicates strong buy momentum, and the Average Directional Index (ADX) also signals a buy. The Relative Strength Index (RSI) and Commodity Channel Index (CCI) are neutral, while the Stochastic RSI is in the oversold zone, suggesting potential for an upside rebound. Bull/Bear Power (BBP) is positive at 1.01, underscoring buyer dominance in intraday trading. Momentum is strong toward session highs, supported by an intraday volatility of 1.93%, but mixed oscillator signals temper the immediate outlook.
Previously it was reported that Walmart maintained bullish momentum supported by strong earnings, digital growth, and its position above key technical benchmarks. The current analysis strengthens that view with fresh upside signals from both price action and momentum indicators, highlighting $129.69 as the key level to monitor for a potential continuation higher.











-
 Afghanistan
-
 Albania
-
 Algeria
-
 Angola
-
 Argentina
-
 Armenia
-
 Australia
-
 Austria
-
 Azerbaijan
-
 Bahamas
-
 Bahrain
-
 Bangladesh
-
 Belarus
-
 Belgium
-
 Bolivia
-
 Botswana
-
 Brazil
-
 Brunei
-
 Bulgaria
-
 Cambodia
-
 Cameroon
-
 Canada
-
 Chile
-
 China
-
 Colombia
-
 Congo
-
 Costa Rica
-
 Cote d'Ivoire
-
 Croatia
-
 Cuba
-
 Cyprus
-
 Czechia
-
 DR Congo
-
 Denmark
-
 Dominican Republic
-
 Ecuador
-
 Egypt
-
 El Salvador
-
 Estonia
-
 Eswatini
-
 Ethiopia
-
 Finland
-
 France
-
 Georgia
-
 Germany
-
 Ghana
-
 Greece
-
 Haiti
-
 Hong Kong
-
 Hungary
-
 India
-
 Indonesia
-
 Iran, Islamic republic
-
 Iraq
-
 Ireland
-
 Israel
-
 Italy
-
 Jamaica
-
 Japan
-
 Jordan
-
 Kazakhstan
-
 Kenya
-
 Korea
-
 Kuwait
-
 Kyrgyzstan
-
 Laos
-
 Latvia
-
 Lebanon
-
 Lesotho
-
 Libya
-
 Lithuania
-
 Luxembourg
-
 Madagascar
-
 Malaysia
-
 Malta
-
 Mauritius
-
 Mexico
-
 Moldova
-
 Mongolia
-
 Montenegro
-
 Morocco
-
 Mozambique
-
 Myanmar
-
 Namibia
-
 Nepal
-
 Netherlands
-
 New Zealand
-
 Nigeria
-
 North Macedonia
-
 Norway
-
 Oman
-
 Pakistan
-
 Palestine
-
 Panama
-
 Papua New Guinea
-
 Paraguay
-
 Peru
-
 Philippines
-
 Poland
-
 Portugal
-
 Puerto Rico
-
 Qatar
-
 Reunion
-
 Romania
-
 Rwanda
-
 Saudi Arabia
-
 Serbia
-
 Singapore
-
 Slovakia
-
 Slovenia
-
 Somalia
-
 South Africa
-
 Spain
-
 Sri Lanka
-
 Sweden
-
 Switzerland
-
 Syria
-
 Taiwan
-
 Tajikistan
-
 Tanzania
-
 Thailand
-
 Trinidad and Tobago
-
 Tunisia
-
 Turkey
-
 UAE
-
 Uganda
-
 Ukraine
-
 United Kingdom
-
United States
-
 Uruguay
-
 Uzbekistan
-
 Venezuela
-
 Vietnam
-
 Yemen
-
 Zambia
-
 Zimbabwe
- Forex
- Crypto












