
What Is The Best Moving Average For Swing Trading?



Editorial Note: While we adhere to strict Editorial Integrity, this post may contain references to products from our partners. Here's an explanation for How We Make Money. None of the data and information on this webpage constitutes investment advice according to our Disclaimer.
The best moving average for swing trading:
20-day EMA works well. Tracks short-term momentum shifts.
50-day SMA confirms trends. Helps spot medium-term direction.
100-day SMA adds stability. Filters out short-term noise.
200-day SMA shows strength. Identifies long-term trend support.
Combine MAs for signals. Crossovers improve trade accuracy.
Mastering swing trading technical analysis helps traders make better decisions, and a key tool in this analysis is moving averages. They help traders spot trends and potential price shifts.
Additionally, they offer insights into possible support and resistance levels, but choosing the right moving average matters for success. Which moving average works best for swing trading? This article breaks down moving averages in detail. We'll also explore the best one for swing trading.
Best moving averages for swing trading
Choosing the right moving average (MA) for swing trading depends on your trading style, asset volatility, and time horizon. Different MAs provide varying levels of sensitivity to price movements, helping traders make informed decisions. Here’s a breakdown of the most effective MAs for swing trading:
20-Day EMA – tracks short-term momentum
The 20-day Exponential Moving Average (EMA) is highly responsive to price changes, making it ideal for tracking short-term momentum shifts.
Swing traders often use it to identify entry and exit points, as price movements around this MA can signal a trend’s continuation or reversal.
Works well in high-volatility markets where quick reactions are needed.
50-Day SMA – confirms medium-term trends
The 50-day Simple Moving Average (SMA) provides a broader view of the trend compared to the 20-day EMA.
Helps traders filter out market noise and focus on medium-term price direction.
A price crossing above or below this MA often signals a shift in market sentiment.
100-Day SMA – adds stability and trend validation
The 100-day SMA smooths out price fluctuations and acts as a strong support/resistance level in swing trading.
Helps traders avoid false breakouts by filtering short-term market noise.
Often used in combination with shorter MAs to confirm trend strength.
200-Day SMA – identifies long-term trend strength
The 200-day SMA is a key indicator for determining overall market direction.
When price is above the 200-day SMA, the asset is generally in a long-term uptrend, and when below, a downtrend.
Acts as a strong dynamic support or resistance level, influencing institutional trading strategies.
Combining Moving Averages for stronger signals
Golden Cross: When the 50-day SMA crosses above the 200-day SMA, it signals a potential bullish breakout.
Death Cross: When the 50-day SMA crosses below the 200-day SMA, it indicates a possible bearish downturn.
Shorter EMAs (e.g., 20-day) combined with longer SMAs (e.g., 50-day) help traders fine-tune entries and exits.
| Best For | Use Case | Best EMA Settings | |
|---|---|---|---|
| Exponential Moving Average (EMA) | Capturing early trend reversals. | Perfect for short- to medium-term swing traders looking for timely entry and exit points. |
|
| Simple Moving Average (SMA) | Smooths price action, making it less sensitive to short-term volatility. | Suitable for identifying long-term swing trading opportunities and confirming major trend directions. |
|
Understanding moving averages

Most traders look at moving averages as just another trend-following tool, but the real pros know they’re more like price magnets. Big institutions and trading bots don’t just react to levels like the 50-day or 200-day moving average — they shape them. In fast-moving markets, you’ll see price snap back to the 50-day MA as high-frequency traders cash in on short-term imbalances.
But when the market slows down, the focus shifts, and suddenly, the 200-day moving average becomes a battleground for long-term positions. If you’re using the same moving average strategy no matter the market conditions, you’re missing out on how these levels evolve.
Moving averages don’t just track trends — they mess with traders’ psychology. A stock hovering near its 21-day MA can trigger a panic sell-off if it dips below, not because it’s a magic number, but because enough traders believe in it. In big markets like Forex, long-term moving averages hold more weight since large players respect them.
But in smaller markets, quick-moving averages like the 9-day or 21-day see way more action since they align with shorter-term momentum plays. Instead of using the same moving average for every trade, try adjusting based on the market cycle — shorter averages when the trend is hot and longer ones when things slow down. That way, you’re not just reacting to the market — you’re staying ahead of it.
Types of moving averages
Most traders use moving averages, but mastering their advanced applications can significantly improve your strategy. Here are unique insights into different types of moving averages.
Simple moving average (SMA). Best for filtering noise in high-volatility markets, but ineffective for short-term signals due to delayed responsiveness. Works well for long-term trend confirmation when paired with momentum indicators like RSI.
Exponential moving average (EMA). Ideal for fast-moving markets as it reacts quickly to price changes, but prone to false signals in choppy conditions. Works best with ATR - based volatility filters to confirm breakouts.
Weighted moving average (WMA). More responsive than SMA but less erratic than EMA, making it useful for intraday traders. Works well when combined with Heikin Ashi candles to smooth out noise and capture strong trends.
Hull moving average (HMA). Reduces lag while maintaining smoothness, making it perfect for swing trading. Works best with Fibonacci retracement levels for precision entries.
Volume-weighted moving average (VWMA). Adjusts based on trading volume, making it essential for spotting institutional activity. Most effective when paired with footprint charts to analyze large orders.
EMA vs SMA: which is better?
If you trade frequently, want faster signals, or prefer to react quickly to market trends, you can use EMA. On the other hand, use SMA if you trade less frequently, focus on long-term trends, or value smoother and more stable trend signals. So, which EMA is best for swing trading?
The 20, 50, and 200-period EMAs are best for swing trading.
20-period EMA. Captures short-term trends, ideal for quick entries and exits.
50-period EMA. Highlights medium-term trends, balancing reliability and responsiveness.
200-period EMA. Identifies long-term trends and key support and resistance levels, confirming market direction.
For swing traders, a solid crossover strategy is the 20-period EMA and 50-period EMA, while the 50-period EMA and 200-period EMA signal the golden cross or death cross. These setups help blend short- and medium-term trends, making it easier to find good entry and exit levels.
Using EMAs instead of SMAs makes sure price reactions are quick, which is key for swing trading. But combining both can improve accuracy. For example, a 50-day SMA can define the trend, while a 20-day EMA fine-tunes trade entries. This mix of stability and speed works well for swing traders.
Also, the Moving Average Convergence Divergence (MACD) indicator helps track momentum and spot trade setups using EMAs.
MACD settings for swing trading
The Moving Average Convergence Divergence (MACD) indicator is a valuable tool for swing traders, offering insights into market momentum and potential entry and exit points.
Default MACD settings (12, 26, 9)

Fast EMA (12). Captures short-term momentum.
Slow EMA (26). Reflects longer-term trends.
Signal Line EMA (9). Smooths the MACD line for clearer signals.
These settings are effective on daily or 4-hour charts in trending markets.
Short-term swing trading settings (5, 13, 8)
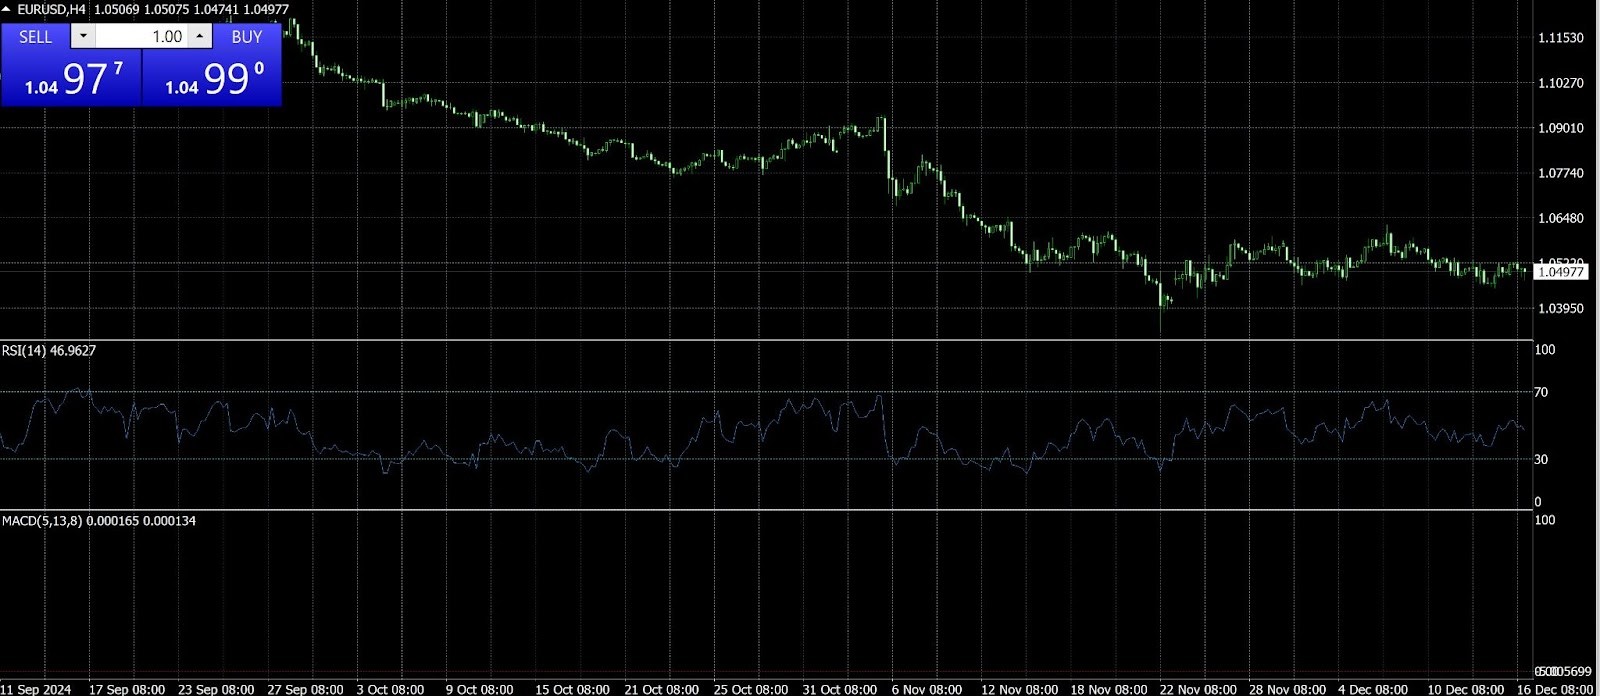
Fast EMA (5). Increases sensitivity to recent price changes.
Slow EMA (13). Tracks intermediate trends.
Signal Line EMA (8). Provides timely signals for active traders.
Ideal for 1-hour or 4-hour charts in volatile markets.
Long-term swing trading settings (19, 39, 9)

Fast EMA (19). Focuses on broader market movements.
Slow EMA (39). Emphasizes long-term trends.
Signal Line EMA (9). Maintains standard smoothing for signal clarity.
Suitable for daily or weekly charts, reducing false signals by concentrating on overarching trends. However, adjusting MACD settings to align with specific trading timeframes and market conditions can enhance the accuracy and profitability of swing trading strategies.
Technical indicators to combine with moving averages
To maximize the effectiveness of moving averages like SMA and EMA, pairing them with advanced indicators can provide unique market insights beyond common strategies.
Relative momentum index (RMI) for trend confirmation. Unlike RSI, RMI smooths out noise and focuses on directional strength over multiple periods, making it a better fit for trending markets when used alongside EMAs.
Klinger volume oscillator for trend validation. This volume-based indicator helps confirm whether price movements backed by moving averages have real strength or are just weak pullbacks that might reverse.
TTM Squeeze to detect pre-breakout setups. When moving averages tighten, adding TTM Squeeze reveals when volatility compression is likely to lead to explosive breakouts, helping traders position before the move.
Choppiness index to avoid fakeouts. Many traders get caught in false breakouts when using moving averages alone. The Choppiness Index helps gauge whether the market is truly trending or still stuck in a consolidation phase.
Anchored VWAP for institutional-level entries. Standard VWAP resets daily, but Anchored VWAP lets traders select key swing points, helping align EMA or SMA signals with institutional order flow for precision entries.

Most traders use moving averages the wrong way — here’s how to apply them like a pro for maximum returns.
Use dynamic stop losses. Instead of fixed stops, trail them just below the moving average to capture more gains without getting stopped out prematurely.
Combine multiple timeframes. Don’t rely on one chart — use a longer timeframe to identify trends and a shorter one to fine-tune entries based on moving average reactions.
Spot momentum shifts early. Watch for price pinning against a moving average before a breakout, as this signals strong accumulation or distribution.
Trade the “moving average squeeze”. When short and long moving averages compress tightly before expanding, it often precedes an explosive move — enter just as the expansion starts.
Avoid “moving average magnets”. Prices often get sucked into major moving averages, leading to fake signals. Wait for a decisive break and retest before entering.
Using 10-day and 21-day EMAs for precise swing trading entries and trend-following with Fibonacci-based EMAs

Most traders stick to the basic 50-day and 200-day moving averages, but those alone won’t cut it for swing trading. The 10-day exponential moving average (EMA) is a game-changer when paired with the 21-day EMA, helping you spot momentum shifts faster. When the 10-day EMA crosses above the 21-day EMA with strong volume, this is a strong signal for a trade setup. The key is to avoid fake signals — watch how price reacts when revisiting the 21-day EMA. If it bounces without breaking below, buyers are still in control, letting you add to a winning position with minimal risk.
For longer swings, the 34-day and 89-day EMAs work better than standard moving averages for swing traders. Unlike round-number moving averages, these Fibonacci-based EMAs match how price naturally moves over time. They’re great for trend-following stocks, letting you hold trades longer without getting faked out. If price stays above the 34-day EMA while the 89-day acts as deeper support, the trend is still strong. Many traders exit too soon — following these EMAs helps you stay in strong trends unless the 34-day clearly breaks with big selling pressure.
Conclusion
The right moving average for swing trading helps you see market trends clearly, making it easier to choose the right moments to trade. Instead of just relying on the 20-period moving average, experiment with mixing EMA and SMA to suit your style. You can also tweak MACD settings for better swing trading results. Always make sure your strategy fits your trading goals. Get hands-on experience with these approaches on a demo account to sharpen your skills and build confidence before hitting the live market.
FAQs
Which moving average is best for swing trading?
The Exponential Moving Average (EMA) is best for swing trading due to its fast responsiveness, while the Simple Moving Average (SMA) works well for confirming long-term trends.
How do moving averages help identify market trends?
Moving averages smooth out price data, making it easier to spot overall market trends by filtering out short-term volatility.
What is the best EMA for swing trading crypto?
The 9-day EMA and 21-day EMA are commonly used for swing trading crypto, offering quick trend detection and timely entry/exit signals.
What are the best MACD settings for swing trading?
The default MACD (12, 26, 9) works well for swing trading, though (5, 13, 8) is ideal for short-term trades and (19, 39, 9) suits long-term strategies.
Editors' Top Picks and Insights

Bitcoin mining is getting greener, but the debate isn't over

Asia's largest IPO: How CXMT became China's most valuable company

Global fintech in 2026: Three trends that matter

From Jesus Christ to aliens: Polymarket's most absurd prediction markets

Hunting crypto owners: Why criminals have gone offline

BitMEX is shutting down: Why Trump could not save the exchange
Related Articles
Team that worked on the article
Peter Emmanuel Chijioke is a professional personal finance, Forex, crypto, blockchain, NFT, and Web3 writer and a contributor to the Traders Union website. As a computer science graduate with a robust background in programming, machine learning, and blockchain technology, he possesses a comprehensive understanding of software, technologies, cryptocurrency, and Forex trading.
Chinmay Soni is a financial analyst with more than 5 years of experience in working with stocks, Forex, derivatives, and other assets. As a founder of a boutique research firm and an active researcher, he covers various industries and fields, providing insights backed by statistical data.
Mirjan Hipolito is a journalist and news editor at Traders Union. She is an expert crypto writer with five years of experience in the financial markets.
Swing trading is a trading strategy that involves holding positions in financial assets, such as stocks or forex, for several days to weeks, aiming to profit from short- to medium-term price swings or "swings" in the market. Swing traders typically use technical and fundamental analysis to identify potential entry and exit points.
CFD is a contract between an investor/trader and seller that demonstrates that the trader will need to pay the price difference between the current value of the asset and its value at the time of contract to the seller.
Cryptocurrency is a type of digital or virtual currency that relies on cryptography for security. Unlike traditional currencies issued by governments (fiat currencies), cryptocurrencies operate on decentralized networks, typically based on blockchain technology.
Day trading involves buying and selling financial assets within the same trading day, with the goal of profiting from short-term price fluctuations, and positions are typically not held overnight.
Moving Average is a commonly used technical indicator that smooths out price data over a specific period to identify the underlying trend. It is calculated by averaging the prices of an asset over a chosen time frame, making it a valuable tool for trend-following and trend-reversal strategies.

-
 Afghanistan
-
 Albania
-
 Algeria
-
 Angola
-
 Argentina
-
 Armenia
-
 Australia
-
 Austria
-
 Azerbaijan
-
 Bahamas
-
 Bahrain
-
 Bangladesh
-
 Belarus
-
 Belgium
-
 Bolivia
-
 Botswana
-
 Brazil
-
 Brunei
-
 Bulgaria
-
 Cambodia
-
 Cameroon
-
 Canada
-
 Chile
Chile
-
 China
China
-
 Colombia
-
 Congo
Congo
-
 Costa Rica
-
 Cote d'Ivoire
-
 Croatia
-
 Cuba
Cuba
-
 Cyprus
-
 Czechia
-
 DR Congo
-
 Denmark
-
 Dominican Republic
-
 Ecuador
-
 Egypt
Egypt
-
 El Salvador
-
 Estonia
-
 Eswatini
-
 Ethiopia
-
 Finland
-
 France
-
 Georgia
-
 Germany
-
 Ghana
Ghana
-
 Greece
-
 Haiti
Haiti
-
 Hong Kong
-
 Hungary
-
 India
India
-
 Indonesia
-
 Iran, Islamic republic
-
 Iraq
Iraq
-
 Ireland
-
 Israel
-
 Italy
Italy
-
 Jamaica
-
 Japan
Japan
-
 Jordan
-
 Kazakhstan
-
 Kenya
Kenya
-
 Korea
Korea
-
 Kuwait
-
 Kyrgyzstan
-
 Laos
Laos
-
 Latvia
-
 Lebanon
-
 Lesotho
-
 Libya
Libya
-
 Lithuania
-
 Luxembourg
-
 Madagascar
-
 Malaysia
-
 Malta
Malta
-
 Mauritius
-
 Mexico
-
 Moldova
-
 Mongolia
-
 Montenegro
-
 Morocco
-
 Mozambique
-
 Myanmar
-
 Namibia
-
 Nepal
Nepal
-
 Netherlands
-
 New Zealand
-
 Nigeria
-
 North Macedonia
-
 Norway
-
 Oman
Oman
-
 Pakistan
-
 Palestine
-
 Panama
-
 Papua New Guinea
-
 Paraguay
-
 Peru
Peru
-
 Philippines
-
 Poland
-
 Portugal
-
 Puerto Rico
-
 Qatar
Qatar
-
 Reunion
-
 Romania
-
 Rwanda
-
 Saudi Arabia
-
 Serbia
-
 Singapore
-
 Slovakia
-
 Slovenia
-
 Somalia
-
 South Africa
-
 Spain
Spain
-
 Sri Lanka
-
 Sweden
-
 Switzerland
-
 Syria
Syria
-
 Taiwan
-
 Tajikistan
-
 Tanzania
-
 Thailand
-
 Trinidad and Tobago
-
 Tunisia
-
 Turkey
-
 UAE
UAE
-
 Uganda
-
 Ukraine
-
 United Kingdom
-
United States
-
 Uruguay
-
 Uzbekistan
-
 Venezuela
-
 Vietnam
-
 Yemen
Yemen
-
 Zambia
-
 Zimbabwe
- Forex
- Crypto












