How To Use Chaikin Money Flow


Editorial Note: While we adhere to strict Editorial Integrity, this post may contain references to products from our partners. Here's an explanation for How We Make Money. None of the data and information on this webpage constitutes investment advice according to our Disclaimer.
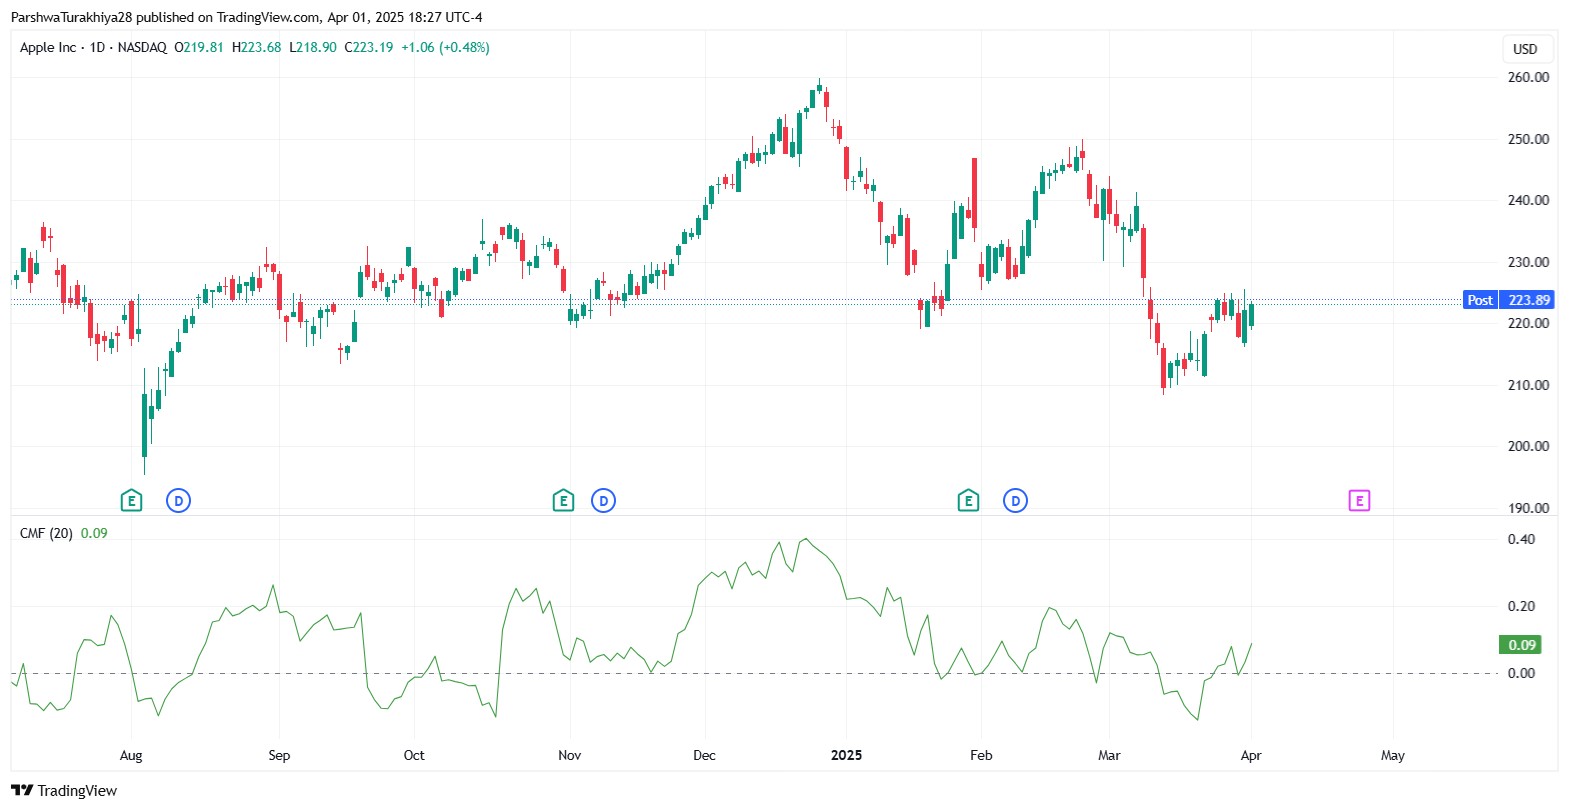
Chaikin Money Flow reveals the real buying or selling pressure behind price moves by combining volume and price position. It becomes most powerful when it diverges from price action showing early signs of a reversal or weakening momentum before it becomes visible on the chart.
Most traders glance at Chaikin Money Flow and move on, treating it like just another chart line. But its real strength shows up when it tells a different story than the price. CMF is about uncovering the buying or selling pressure building beneath the surface — especially when that pressure runs opposite to the trend. If CMF turns red while price keeps rising, that’s often the first quiet signal that momentum is fading. It’s not just about volume — it reveals who’s really in control of the move, and when that control might be slipping.
Introduction to Chaikin Money Flow
The Chaikin Money Flow (CMF) is a popular tool among traders who want to see whether money is flowing into or out of a stock or other asset. Instead of just looking at price, it combines price and volume to show whether buyers or sellers are really in control.
What it actually shows
Above zero = buying pressure When the CMF is in positive territory, it usually means more buying is happening.
Below zero = selling pressure A CMF value under zero suggests that sellers are stronger at that moment.
Confirms or questions the trend If the price is rising but CMF is falling, that might be a warning that the move isn’t backed by strong volume.
How traders use it
Backs up breakouts If a breakout happens and CMF is rising, it suggests the move has volume support — and might be more reliable.
Spotting early reversals If price is climbing but CMF is falling, that disconnect might hint at a slowdown or reversal ahead.
Better entry and exit planning When used alongside price action, CMF helps filter out weak signals.
Origin and development of Chaikin Money Flow
Marc Chaikin created the CMF to help traders see the real push behind price moves. By combining volume and price, he gave traders a way to tell if what’s happening on the chart is being driven by real money or not.
Who created it
Marc Chaikin A former institutional trader, Chaikin focused on tools that showed what was really happening under the surface — not just what the price looked like.
Built for everyday traders While his background was on Wall Street, he made his indicators easy enough for individual traders to use with confidence.
Creator of other tools too CMF isn’t his only contribution — the Chaikin Oscillator and other volume-based indicators also carry his name.
How CMF became popular
Came out in the 1980s Around the time technical analysis was becoming more accessible, CMF filled a gap by tying price to volume flow.
Gained fast adoption Once traders saw how it could confirm breakouts and trends, it became a staple in many trading platforms.
Still in use today Even with newer tools available, CMF remains relevant because of its simplicity and the edge it can offer when read properly.
Understanding the components of Chaikin Money Flow
The Chaikin Money Flow (CMF) doesn’t just give you a number — it shows what’s really going on behind the price. To make the most of it, it helps to break down what each part means so you know why the line moves the way it does.
Where the price closes in the candle
The first thing CMF looks at is whether the price closes near the high, the low, or somewhere in between. This tells you who had control during that candle.
Why it’s important
Close near the top That’s usually a sign buyers had the upper hand.
Close near the bottom Sellers were stronger in that session.
Close in the middle A balanced battle — neither side clearly won.
What it means for CMF
If the price closes near the high, the value for that candle pushes CMF upward;
If it’s near the low, it pulls CMF lower.
How much volume backed the move
Next comes volume — and it adds a lot of context. A strong price move means more when it’s backed by heavy trading.
Why it matters
Big volume = serious action When there’s high volume behind a move, it shows more traders are getting involved — and that move is more likely to hold.
Low volume = weak conviction If volume is light, the move might not mean much — it could just be noise.
How CMF uses it
The price position is multiplied by volume;
So big volume candles with a strong close have more influence on the final CMF line.
Putting it all together over time
CMF doesn’t just look at one candle. It smooths out these signals across 20 or 21 candles to get a better view of the trend.
Why this helps
You get fewer false signals Smoothing out the values helps cut through the noise of daily price swings.
You see who’s really in control It becomes easier to tell if buyers or sellers have had the edge recently.
What the final number tells you
Above zero = buyers leading More money is flowing in than out.
Below zero = sellers dominating More money is flowing out of the asset.
Around zero = no clear trend The market might be pausing or waiting on a catalyst.
How to set up chaikin money flow
You don’t need any complicated setup to start using the Chaikin Money Flow. Most platforms include it, and it only takes a minute to get it running on your chart. Once added, the line will show how money is moving in or out of the market — helping you make more informed trade decisions.
Access the indicator
Here’s how to get the CMF on your chart.
Steps to follow
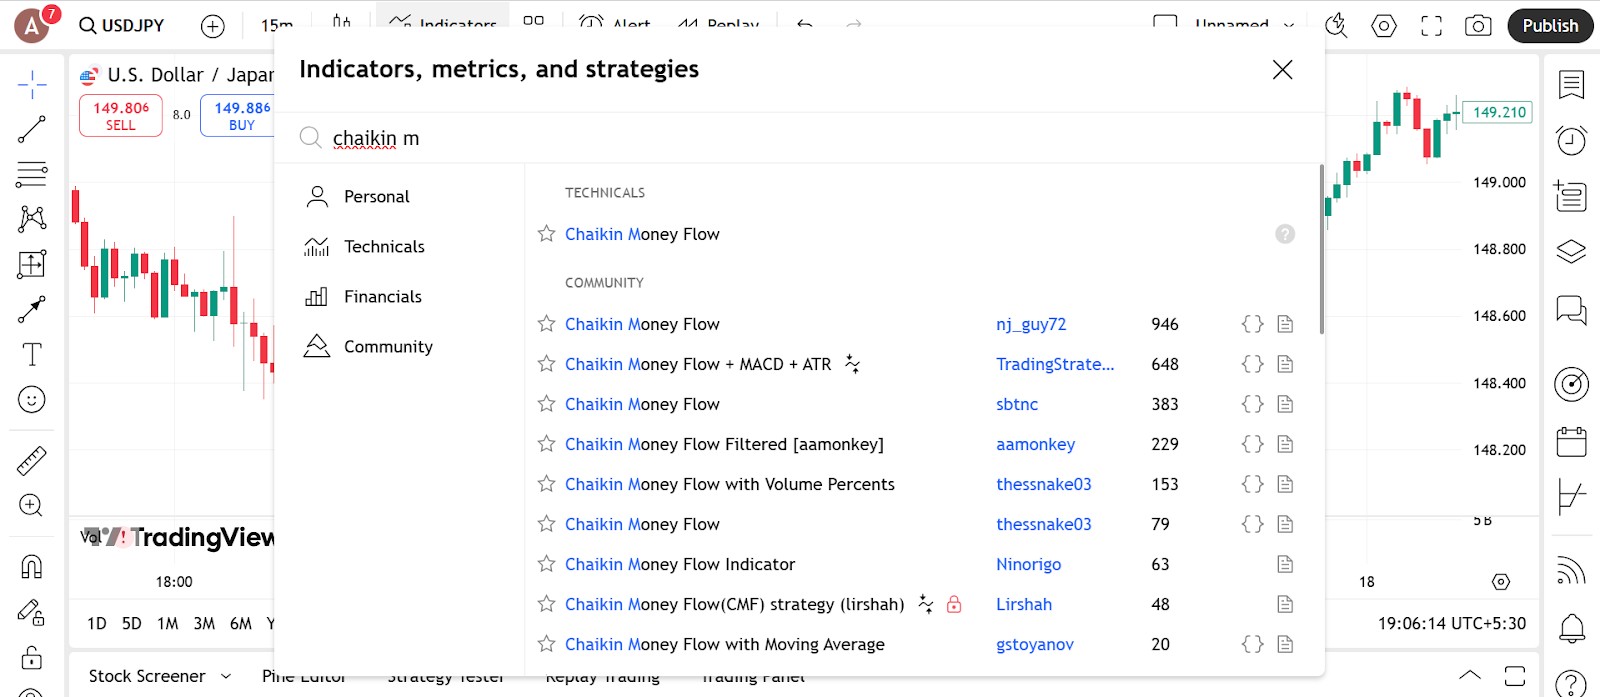
Open your indicators menu Type “Chaikin Money Flow” or just “CMF” into the search bar.
Click to add Select the indicator and it’ll pop up in a separate window below your price chart.
Available on most trading platforms You’ll find CMF on TradingView, MetaTrader, ThinkorSwim, and others without needing to install anything extra.
Quick tips
Save it to your favorites That way you can access it faster in future sessions.
Use it with price and volume It works even better when combined with volume or price action tools like support and resistance.
Configure the parameters
You can leave CMF on its default settings, but there are ways to tweak it for different trading styles.
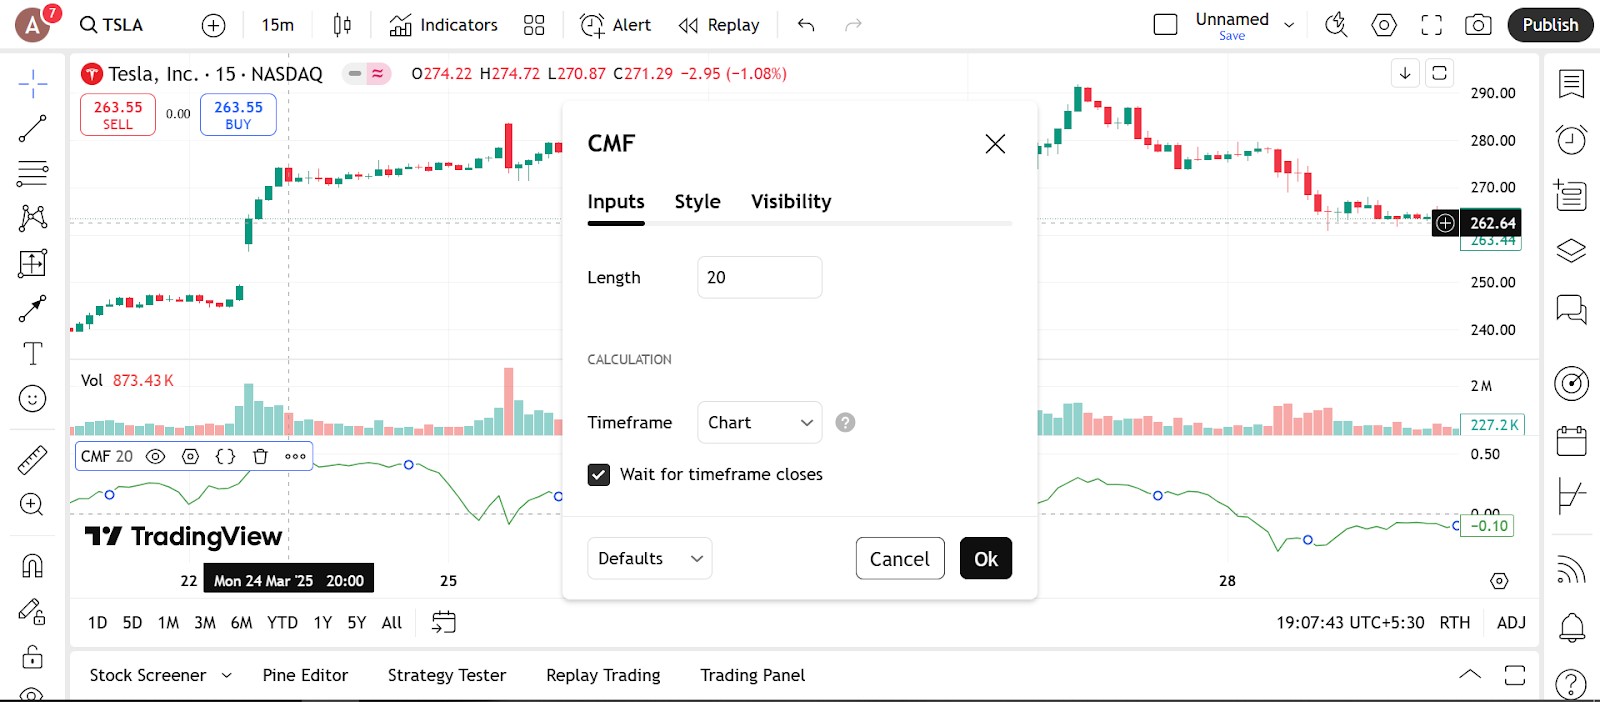
Set the period
Default is 20 or 21 This gives a balanced view and works for most traders.
Go shorter for faster signals If you’re scalping or day trading, try 10–14. Just know it might get noisier.
Go longer for cleaner trends A 30+ setting smooths the line and helps filter out weak moves.
Adjust the visuals
Pick a clear color Make the line stand out against your background — that way you won’t miss crossovers.
Add a zero line If your platform allows, adding a bold 0.00 line makes it easier to spot key moments.
Set up alerts if available
Let the platform notify you Set an alert when the CMF crosses zero — it could be a signal to prepare for a trade or double-check your analysis.
Trading strategies using chaikin money flow
The Chaikin Money Flow (CMF) is a versatile tool that can strengthen your trading strategy by highlighting when real buying or selling pressure is behind a price move. Whether you trade breakouts, reversals, or trends, CMF can help filter signals and improve timing. Here are some common and reliable ways traders use it.
Zero line crossover strategy
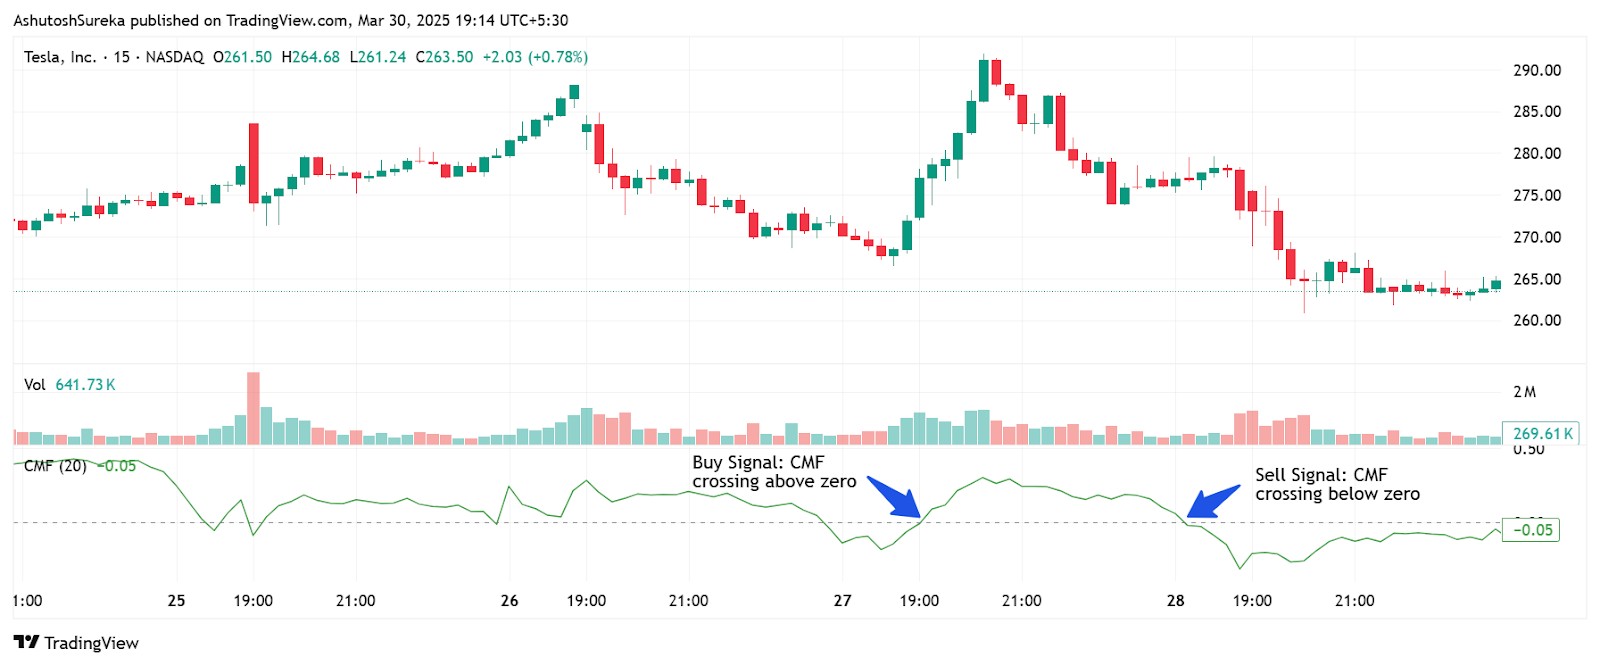
One of the simplest and most widely used strategies with CMF is trading crossovers above or below the zero line.
How it works
CMF crossing above zero Suggests buying pressure is picking up. This can confirm long entries or mark the beginning of a bullish trend.
CMF crossing below zero Indicates selling pressure is growing. This can be used to validate short entries or spot bearish momentum.
Entry and exit tips
Use price action for confirmation Combine CMF crossover with a breakout, pullback, or trendline break for better timing.
Exit when CMF flattens or reverses A flattening CMF line may signal that momentum is weakening.
Divergence strategy
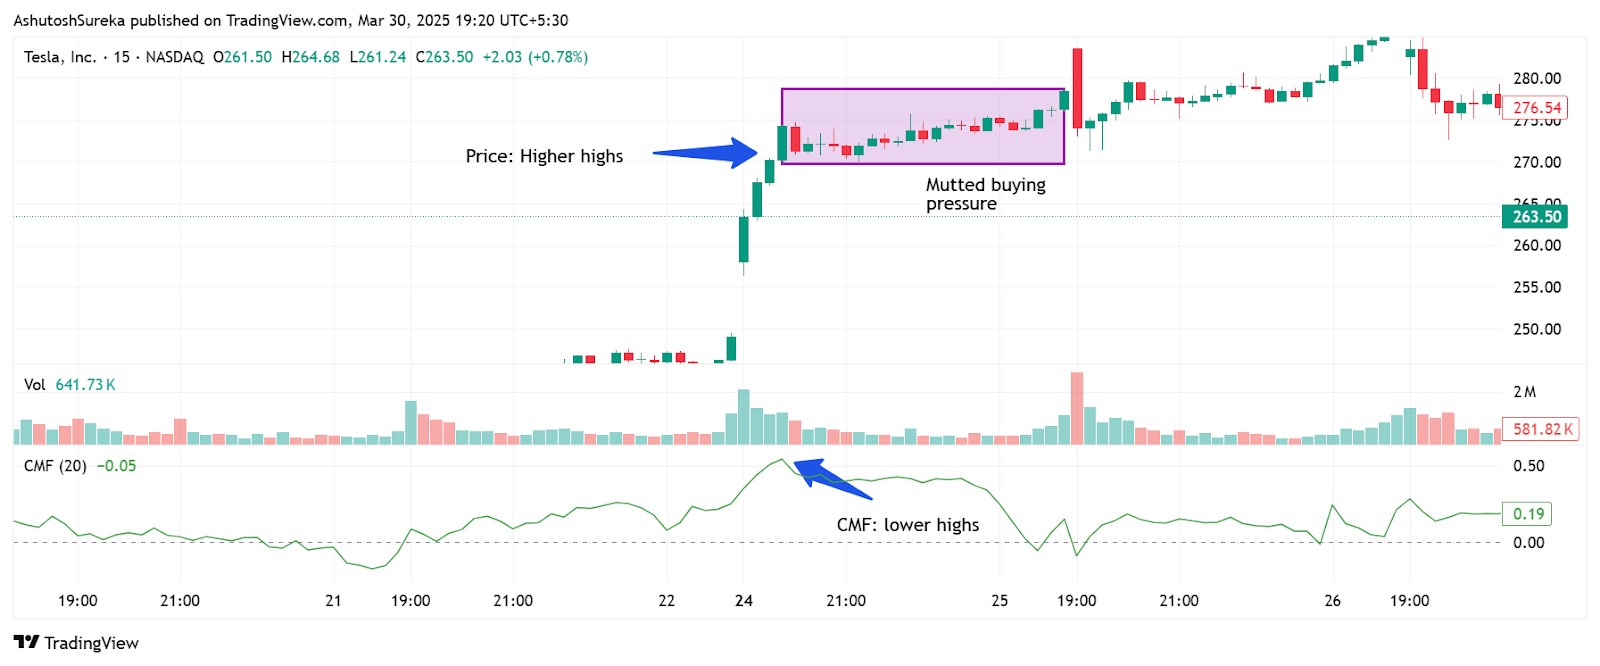
Divergences between CMF and price action can offer early clues that a trend is running out of steam.
How to spot it
Bullish divergence Price makes a lower low, but CMF makes a higher low. This suggests selling pressure is weakening and a reversal could be near.
Bearish divergence Price makes a higher high, but CMF makes a lower high. This shows buying momentum is fading.
How to trade it
Wait for reversal confirmation After spotting divergence, look for a candlestick signal or chart pattern to confirm the shift in trend.
Set conservative stops Divergences can take time to play out, so manage risk tightly in case the trend continues.
Trend confirmation strategy
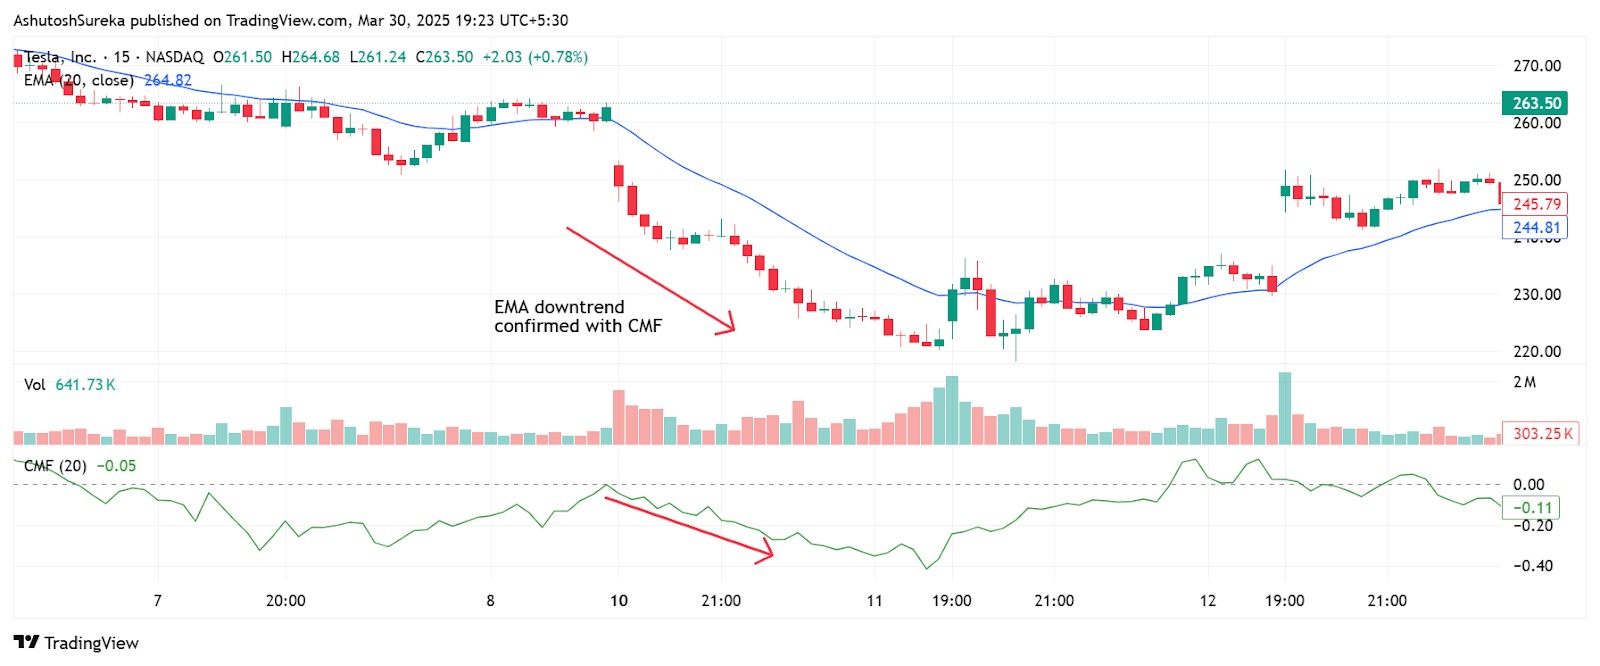
CMF is often used alongside a moving average or price trend to confirm that the direction has real money behind it.
Strategy setup
Follow the trend If price is in an uptrend and CMF is above zero, it adds confidence that the move is supported by buying pressure.
Avoid counter-trend setups If price is rising but CMF stays negative, it could be a weak rally — best to stay cautious.
Works well with
Moving averages (e.g., 50 or 100 SMA) Use CMF to confirm whether price above a moving average is backed by strong volume flow.
Trendlines or channels Use CMF to decide whether a breakout from a trendline is real or likely to fail.
Advantages and limitations of chaikin money flow
The Chaikin Money Flow (CMF) gives you a different way to look at price moves — one that considers whether money is actually behind the action. Like any tool, it has its strengths and weaknesses, and knowing both helps you use it better.
Why traders like CMF
There’s a reason CMF is a go-to for volume-based analysis — it brings more clarity to what’s really going on behind price movements.
It blends price with volume
Price isn’t always the full story CMF shows whether a price move has real backing. It helps you avoid chasing moves that aren’t supported by volume.
Lets you see pressure building When CMF rises, it often means money is flowing in. When it drops, it suggests the opposite.
It can confirm trends or spot reversals
Crossing the zero line gives a clear signal CMF above zero supports bullish trades; below zero backs bearish setups.
Divergences can give early warnings If price keeps rising but CMF is falling, something might be off — it can be your first clue to tighten stops or avoid new entries.
It’s simple and flexible
Easy to understand One line, one baseline — no complex math or multiple settings.
Works on all timeframes Whether you’re trading 5-minute charts or daily candles, CMF adjusts well.
Where CMF can fall short
No indicator is perfect — and CMF is no exception. Here’s what to watch out for.
It can be late in fast markets
It reacts after the move Because it uses past data, CMF may not catch fast breakouts or breakdowns in time.
Divergence isn’t a crystal ball Just because CMF diverges from price doesn’t mean a reversal is coming now. It might take time — or not happen at all.
It’s sensitive to volume spikes
One big candle can throw things off A sudden surge in volume, even if it’s a one-off event, can push CMF sharply — sometimes misleadingly.
Treats all volume the same CMF doesn’t know the difference between real institutional interest and low-quality volume.
You still need other tools
CMF isn’t a trade trigger on its own It gives you insight, not direction. You’ll need other indicators or setups to make solid entries and exits.
Best used as a filter CMF is most helpful when confirming what other parts of your strategy already suggest.
We’ve selected a list of top stock brokers that offer powerful volume analysis tools and customizable indicators — ideal for traders using Chaikin Money Flow in their strategies.
| Foundation year | Account min. | Demo | Deposit Fee | Withdrawal fee | Inactivity fee | Android | iOS | Regulation | TU overall score | Open an account | |
|---|---|---|---|---|---|---|---|---|---|---|---|
| 2007 | No | Yes | No | $25 for wire transfers out | $50 | Yes | Yes | FINRA, SIPC | 7.63 | Open an account Via eOption's secure website. |
|
| 2014 | No | No | No | No charge | No inactivity fees | Yes | Yes | FCA, FSCS, OSC, BCSC, ASC, MSC, IIROC, CIPF. | 7.39 | Open an account Via Wealthsimple's secure website. |
|
| 1919 | No | No | No | $25 | No | Yes | Yes | FDIC, FINRA, SIPC, SEC, CFTC, NFA | 6.61 | Study review | |
| 2015 | No | No | No | No charge up to a limit | Not specified | Yes | Yes | FCA, SEC, FINRA | 7.69 | Study review | |
| 1978 | No | Yes | No | No | No | Yes | Yes | FCA, ASIC, MAS, CFTC, NFA, CIRO | 7.45 | Open an account Your capital is at risk. |
Why trust us
We at Traders Union have analyzed financial markets for over 14 years, evaluating brokers based on 250+ transparent criteria, including security, regulation, and trading conditions. Our expert team of over 50 professionals regularly updates a Watch List of 500+ brokers to provide users with data-driven insights. While our research is based on objective data, we encourage users to perform independent due diligence and consult official regulatory sources before making any financial decisions.
Learn more about our methodology and editorial policies.
Best way to use chaikin money flow

Here’s the trick most people miss: CMF works best after a breakout, not before. Everyone wants to use it to confirm their setup — but the real insight is in what happens next. If a stock breaks out and CMF doesn’t budge — or even dips — that’s a clue the move could just be empty momentum. But if CMF spikes after the breakout, that’s when you know real buyers are getting involved. Big money often waits to show its hand, and CMF spots that before it’s obvious in price.
Another angle that gets slept on? Use CMF to spot where the money’s moving next. Let’s say tech stocks are flying, but CMF on a big tech ETF starts drifting lower. That’s not just noise — it’s the smart money quietly exiting. Meanwhile, CMF starts building in a slow sector like industrials. That usually shows up before price even moves. While everyone else watches candles, you’re tracking the handoff. That shift is where the real setups start.
Conclusion
Chaikin Money Flow gives traders a deeper look at market behavior by showing where real money is moving — not just what the price chart shows on the surface. It’s especially useful when CMF diverges from price action, signaling that a rally or sell-off may not be as strong as it appears. When used with price structure and trend tools, CMF helps confirm whether momentum is genuine or fading.
For traders looking to avoid fake breakouts and spot early trend shifts, CMF offers an edge that many overlook. It’s not about using it as a stand-alone signal, but about understanding the story behind the volume and flow of capital — because in the long run, that’s what truly drives price.
FAQs
How does Chaikin Money Flow measure buying and selling pressure?
Chaikin Money Flow (CMF) measures buying and selling pressure by analyzing both price movement and volume over a set period. A positive CMF value suggests accumulation (buying), while a negative value indicates distribution (selling).
Can Chaikin Money Flow be used for all types of financial instruments?
Yes, CMF can be applied to stocks, Forex, commodities, and ETFs. Its combination of volume and price makes it versatile across different markets and asset classes.
What are the recommended settings for Chaikin Money Flow in short-term trading?
A 20-period CMF is commonly used for short-term trading. Some traders may shorten it to 10 or 14 periods for quicker signals, depending on the asset’s volatility and trading style.
Are there any limitations to using Chaikin Money Flow in volatile markets?
In volatile markets, CMF can give mixed signals due to erratic price and volume changes. It's best used alongside trend or momentum indicators to confirm entry and exit points.
Related Articles
Team that worked on the article
Parshwa is a content expert and finance professional possessing deep knowledge of stock and options trading, technical and fundamental analysis, and equity research. As a Chartered Accountant Finalist, Parshwa also has expertise in Forex, crypto trading, and personal taxation. His experience is showcased by a prolific body of over 100 articles on Forex, crypto, equity, and personal finance, alongside personalized advisory roles in tax consultation.
Chinmay Soni is a financial analyst with more than 5 years of experience in working with stocks, Forex, derivatives, and other assets. As a founder of a boutique research firm and an active researcher, he covers various industries and fields, providing insights backed by statistical data. He is also an educator in the field of finance and technology.
As an author for Traders Union, he contributes his deep analytical insights on various topics, taking into account various aspects.
Mirjan Hipolito is a journalist and news editor at Traders Union. She is an expert crypto writer with five years of experience in the financial markets. Her specialties are daily market news, price predictions, and Initial Coin Offerings (ICO).
Forex indicators are tools used by traders to analyze market data, often based on technical and/or fundamental factors, to make informed trading decisions.
Algorithmic trading is an advanced method that relies on advanced coding and formulas based on a mathematical model. However, compared to traditional trading methods, the process differs by being automated.
Price action trading is a trading strategy that relies primarily on the analysis of historical price movements and patterns in financial markets, such as stocks, currencies, or commodities. Traders who use this approach focus on studying price charts, candlestick patterns, support and resistance levels, and other price-related data to make trading decisions.
Forex trading, short for foreign exchange trading, is the practice of buying and selling currencies in the global foreign exchange market with the aim of profiting from fluctuations in exchange rates. Traders speculate on whether one currency will rise or fall in value relative to another currency and make trading decisions accordingly. However, beware that trading carries risks, and you can lose your whole capital.
Volatility refers to the degree of variation or fluctuation in the price or value of a financial asset, such as stocks, bonds, or cryptocurrencies, over a period of time. Higher volatility indicates that an asset's price is experiencing more significant and rapid price swings, while lower volatility suggests relatively stable and gradual price movements.


-
 Afghanistan
-
 Albania
-
 Algeria
-
 Argentina
-
 Armenia
-
 Australia
-
 Austria
-
 Azerbaijan
-
 Bahamas
-
 Bahrain
-
 Bangladesh
-
 Belgium
-
 Botswana
-
 Brazil
-
 Brunei
-
 Bulgaria
-
 Burma
Burma
-
 Cambodia
-
 Cameroon
-
 Canada
-
 Chile
Chile
-
 China
China
-
 Colombia
-
 Costa Rica
-
 Cote d'Ivoire
-
 Croatia
-
 Cyprus
-
 Czech Republic
-
 Denmark
-
 Dominican Republic
-
 Ecuador
-
 Egypt
Egypt
-
 Estonia
-
 Eswatini
-
 Ethiopia
-
 Finland
-
 France
-
 Georgia
-
 Germany
-
 Ghana
Ghana
-
 Greece
-
 Haiti
Haiti
-
 Hong Kong
-
 Hungary
-
 India
India
-
 Indonesia
-
 Iran, Islamic republic
-
 Iraq
Iraq
-
 Ireland
-
 Israel
-
 Italy
Italy
-
 Jamaica
-
 Japan
Japan
-
 Jordan
-
 Kazakhstan
-
 Kenya
Kenya
-
 Korea
Korea
-
 Kuwait
-
 Kyrgyzstan
-
 Laos
Laos
-
 Latvia
-
 Lebanon
-
 Libyan Arab Jamahiriya
-
 Lithuania
-
 Luxembourg
-
 Macedonia
-
 Madagascar
-
 Malaysia
-
 Malta
Malta
-
 Mauritius
-
 Mexico
-
 Moldova
-
 Mongolia
-
 Montenegro
-
 Morocco
-
 Mozambique
-
 Namibia
-
 Nepal
Nepal
-
 Netherlands
-
 Nigeria
-
 Norway
-
 Oman
Oman
-
 Pakistan
-
 Palestine
-
 Papua New Guinea
-
 Peru
Peru
-
 Philippines
-
 Poland
-
 Portugal
-
 Puerto Rico
-
 Qatar
Qatar
-
 Romania
-
 Rwanda
-
 Saudi Arabia
-
 Serbia
-
 Singapore
-
 Slovakia
-
 Slovenia
-
 Somalia
-
 South Africa
-
 Spain
Spain
-
 Sri Lanka
-
 Sweden
-
 Switzerland
-
 Syrian Arab Republic
-
 Taiwan
-
 Tajikistan
-
 Tanzania, United Republic Of
-
 Thailand
-
 Trinidad and Tobago
-
 Tunisia
-
 Turkey
-
 UAE
UAE
-
 Uganda
-
 Ukraine
-
 United Kingdom
-
United States
-
 Uzbekistan
-
 Venezuela
-
 Vietnam
-
 Yemen
Yemen
-
 Zambia
-
 Zimbabwe
- Forex
- Crypto
