
What's behind Brent crude's latest 4.5% price pullback?

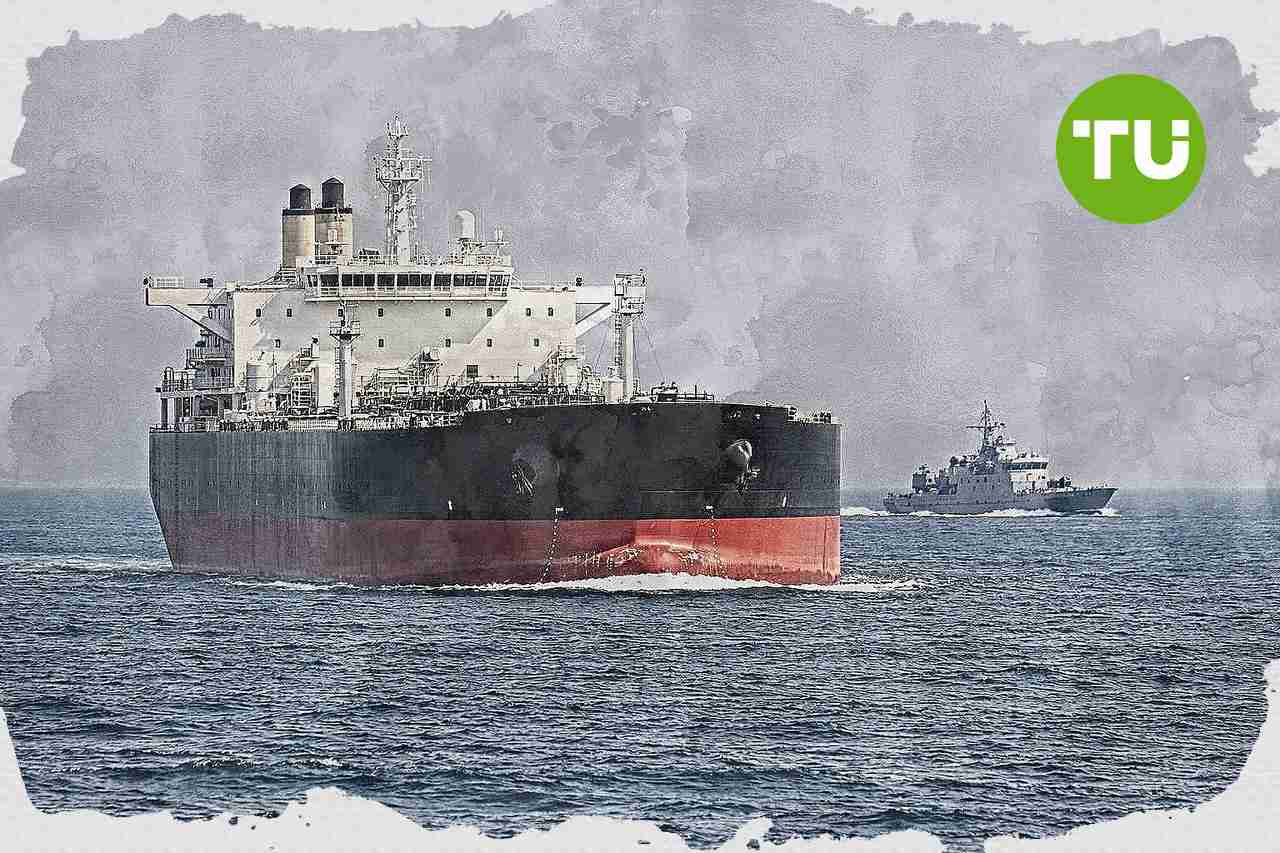
Brent crude oil (XBR) fell 4.5% after heightened geopolitical tensions involving Iran’s Revolutionary Guards and US military sites in the Gulf region drove volatility across energy markets. The drop is reinforced by persistent bearish momentum and pressure, with prices holding just above their short-term floor and well below key medium- and long-term moving averages.
 76.83
80.60
76.83
80.60
Highlights
- Iran's Revolutionary Guards attacked US military positions in Bahrain and Kuwait, escalating geopolitical tensions following tanker incidents in the Strait of Hormuz.
- Persistent threats by Iran to close the Strait of Hormuz and regional security uncertainty are driving heightened sensitivity in Brent crude oil prices.
- XBR/USD faces bearish momentum with high selling pressure; expected range is $70.89 to $80.47 over the next five sessions, with a 65% probability of downward movement.
Gulf security risks trigger price swings as market reacts to conflict
Reports indicated Iran's Revolutionary Guards struck US military sites in Bahrain and Kuwait following tanker attacks in the Strait of Hormuz. Additional news covered Iran threatening to close the Strait of Hormuz if confronted with new attacks, and ongoing uncertainty over the security situation in the Gulf has continued to influence Brent crude oil. These developments emphasize the sensitivity of Brent prices to geopolitical risks in the region.
Mixed momentum as bearish signals challenge technical support levels
XBR/USD is trading slightly above its 20-day moving average (MA-20) at $75.62 but remains well below the 50-day (MA-50) at $88.94 and 200-day (MA-200) at $81.32. This alignment suggests mild short-term support yet ongoing pressure on the medium- and long-term trends. The near-term ceiling stands at $75.95, with the nearest floor at $75.62. The Ichimoku Kijun at $83.25 confirms persistent overhead resistance, and the MA-50 versus MA-200 alignment is bullish from a longer-term perspective. Momentum signals are broadly bearish: Moving Average Convergence Divergence (MACD) is weak with a strong sell bias, and the Average Directional Index (ADX) reinforces selling pressure. Oscillator readings are mixed: RSI is just below the midline at 49.33 with a sell forecast, Stochastic RSI is deeply overbought at 100, CCI is neutral, and Bull/Bear Power (BBP) at 5.3 shows buyers still dominate intraday momentum but forecasts overbought status. Awesome Oscillator (AO) is neutral and does not support the trend. The pair is currently at $75.68, having dropped $3.5633 or 4.5% after opening with a downside gap of about $0.42 (0.53%). The current price is near the session's low, and intraday volatility stands at 4.28%. Intraday tone reflects pronounced weakness and pressure after the open, and mixed signals from the oscillators and momentum indicators highlight a divergence in short-term dynamics.
Earlier, analysts noted that Brent crude’s outlook was dominated by heightened geopolitical tensions and a bias toward further downside. Fresh escalation in the Gulf region and intensified bearish momentum now reinforce the downside case, with traders advised to closely watch for a decisive break below $75.62, as this could open the way toward the lower end of the five-session volatility range.









-
 Afghanistan
-
 Albania
-
 Algeria
-
 Angola
-
 Argentina
-
 Armenia
-
 Australia
-
 Austria
-
 Azerbaijan
-
 Bahamas
-
 Bahrain
-
 Bangladesh
-
 Belarus
-
 Belgium
-
 Bolivia
-
 Botswana
-
 Brazil
-
 Brunei
-
 Bulgaria
-
 Cambodia
-
 Cameroon
-
 Canada
-
 Chile
Chile
-
 China
China
-
 Colombia
-
 Congo
Congo
-
 Costa Rica
-
 Cote d'Ivoire
-
 Croatia
-
 Cuba
Cuba
-
 Cyprus
-
 Czechia
-
 DR Congo
-
 Denmark
-
 Dominican Republic
-
 Ecuador
-
 Egypt
Egypt
-
 El Salvador
-
 Estonia
-
 Eswatini
-
 Ethiopia
-
 Finland
-
 France
-
 Georgia
-
 Germany
-
 Ghana
Ghana
-
 Greece
-
 Haiti
Haiti
-
 Hong Kong
-
 Hungary
-
 India
India
-
 Indonesia
-
 Iran, Islamic republic
-
 Iraq
Iraq
-
 Ireland
-
 Israel
-
 Italy
Italy
-
 Jamaica
-
 Japan
Japan
-
 Jordan
-
 Kazakhstan
-
 Kenya
Kenya
-
 Korea
Korea
-
 Kuwait
-
 Kyrgyzstan
-
 Laos
Laos
-
 Latvia
-
 Lebanon
-
 Lesotho
-
 Libya
Libya
-
 Lithuania
-
 Luxembourg
-
 Madagascar
-
 Malaysia
-
 Malta
Malta
-
 Mauritius
-
 Mexico
-
 Moldova
-
 Mongolia
-
 Montenegro
-
 Morocco
-
 Mozambique
-
 Myanmar
-
 Namibia
-
 Nepal
Nepal
-
 Netherlands
-
 New Zealand
-
 Nigeria
-
 North Macedonia
-
 Norway
-
 Oman
Oman
-
 Pakistan
-
 Palestine
-
 Panama
-
 Papua New Guinea
-
 Paraguay
-
 Peru
Peru
-
 Philippines
-
 Poland
-
 Portugal
-
 Puerto Rico
-
 Qatar
Qatar
-
 Reunion
-
 Romania
-
 Rwanda
-
 Saudi Arabia
-
 Serbia
-
 Singapore
-
 Slovakia
-
 Slovenia
-
 Somalia
-
 South Africa
-
 Spain
Spain
-
 Sri Lanka
-
 Sweden
-
 Switzerland
-
 Syria
Syria
-
 Taiwan
-
 Tajikistan
-
 Tanzania
-
 Thailand
-
 Trinidad and Tobago
-
 Tunisia
-
 Turkey
-
 UAE
UAE
-
 Uganda
-
 Ukraine
-
 United Kingdom
-
United States
-
 Uruguay
-
 Uzbekistan
-
 Venezuela
-
 Vietnam
-
 Yemen
Yemen
-
 Zambia
-
 Zimbabwe
- Forex
- Crypto











