
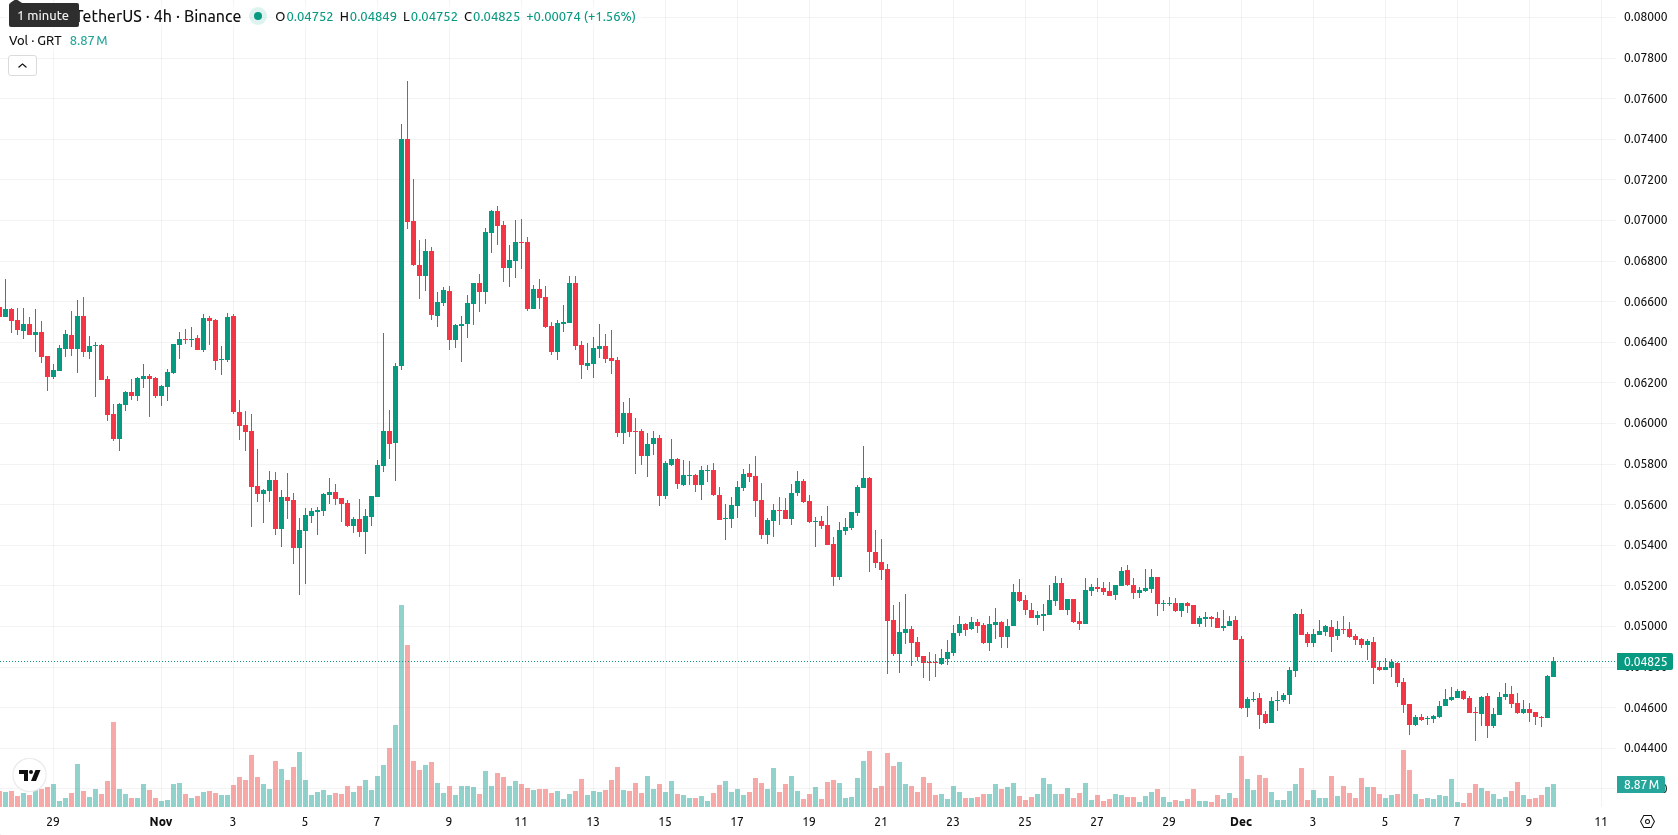
The Graph: oversold oscillators led to a 3.81% move higher

The Graph (GRT) is trading at $0.04824, up 3.81% from the previous close and near the top of today’s intraday range ($0.04504 – $0.04836). The price is below the MA-20 ($0.049465), MA-50 ($0.05692620), and MA-200 ($0.08237080), indicating ongoing seller pressure across short, medium, and long-term timeframes.
Highlights
- GRT trades at $0.04824, remaining below the MA-20 ($0.049465), MA-50 ($0.05692620), and MA-200 ($0.08237080), indicating persistent seller pressure across all timeframes.
- Technical indicators show a bearish outlook: daily MACD and ADX confirm a downtrend, while RSI (35.8) and CCI (-116.4) reveal oversold conditions.
- GRT is likely to consolidate between $0.0445 and $0.0495 in the next five days, with less than 20% probability of a sustained price increase.
Bearish momentum dominates despite oversold signals and support tests
GRT’s current level remains under significant moving average resistance, with key dynamic resistance at the Ichimoku Kijun level of $0.05458 and weak support above $0.045. Momentum signals are mixed: while the D1 MACD shows strong bearish momentum and the ADX confirms an established downtrend, daily RSI at 35.8 and CCI at -116.4 point toward oversold territory. The Stochastic RSI is neutral-to-bullish at 54.4, and BBP is slightly negative, reflecting remaining intraday seller advantage. The Awesome Oscillator stays negative, confirming an ongoing downside bias, and price action continues to reflect weak upside momentum amid divergence between oversold oscillators and persistent bearish signals.
Further downside risk as weak upside momentum tempers rebound odds
Over the next five trading days, the typical volatility range is expected between $0.0445 and $0.0495. Due to prevailing bearish technicals, the probability of a sustained price increase remains below 20%, with further weakness favored. The baseline scenario sees GRT consolidating within this band. A bullish break above $0.0546 would require a momentum reversal, while a drop below $0.0445 could open the way for additional declines toward historical lows or round-number support levels.
Previously it was reported that GRT was trading below all major moving averages, facing strong selling pressure and persistent bearish momentum as confirmed by MACD, ADX, and oversold readings on RSI and CCI. Although the nearest resistance aligns with the Ichimoku Kijun, continued weak momentum and absence of dynamic support above price indicate a high probability of sideways consolidation or further decline within a tight volatility band.


-
 Afghanistan
-
 Albania
-
 Algeria
-
 Angola
-
 Argentina
-
 Armenia
-
 Australia
-
 Austria
-
 Azerbaijan
-
 Bahamas
-
 Bahrain
-
 Bangladesh
-
 Belarus
-
 Belgium
-
 Bolivia
-
 Botswana
-
 Brazil
-
 Brunei
-
 Bulgaria
-
 Cambodia
-
 Cameroon
-
 Canada
-
 Chile
Chile
-
 China
China
-
 Colombia
-
 Congo
Congo
-
 Costa Rica
-
 Cote d'Ivoire
-
 Croatia
-
 Cuba
Cuba
-
 Cyprus
-
 Czechia
-
 DR Congo
-
 Denmark
-
 Dominican Republic
-
 Ecuador
-
 Egypt
Egypt
-
 El Salvador
-
 Estonia
-
 Eswatini
-
 Ethiopia
-
 Finland
-
 France
-
 Georgia
-
 Germany
-
 Ghana
Ghana
-
 Greece
-
 Haiti
Haiti
-
 Hong Kong
-
 Hungary
-
 India
India
-
 Indonesia
-
 Iran, Islamic republic
-
 Iraq
Iraq
-
 Ireland
-
 Israel
-
 Italy
Italy
-
 Jamaica
-
 Japan
Japan
-
 Jordan
-
 Kazakhstan
-
 Kenya
Kenya
-
 Korea
Korea
-
 Kuwait
-
 Kyrgyzstan
-
 Laos
Laos
-
 Latvia
-
 Lebanon
-
 Lesotho
-
 Libya
Libya
-
 Lithuania
-
 Luxembourg
-
 Madagascar
-
 Malaysia
-
 Malta
Malta
-
 Mauritius
-
 Mexico
-
 Moldova
-
 Mongolia
-
 Montenegro
-
 Morocco
-
 Mozambique
-
 Myanmar
-
 Namibia
-
 Nepal
Nepal
-
 Netherlands
-
 New Zealand
-
 Nigeria
-
 North Macedonia
-
 Norway
-
 Oman
Oman
-
 Pakistan
-
 Palestine
-
 Panama
-
 Papua New Guinea
-
 Paraguay
-
 Peru
Peru
-
 Philippines
-
 Poland
-
 Portugal
-
 Puerto Rico
-
 Qatar
Qatar
-
 Reunion
-
 Romania
-
 Rwanda
-
 Saudi Arabia
-
 Serbia
-
 Singapore
-
 Slovakia
-
 Slovenia
-
 Somalia
-
 South Africa
-
 Spain
Spain
-
 Sri Lanka
-
 Sweden
-
 Switzerland
-
 Syria
Syria
-
 Taiwan
-
 Tajikistan
-
 Tanzania
-
 Thailand
-
 Trinidad and Tobago
-
 Tunisia
-
 Turkey
-
 UAE
UAE
-
 Uganda
-
 Ukraine
-
 United Kingdom
-
United States
-
 Uruguay
-
 Uzbekistan
-
 Venezuela
-
 Vietnam
-
 Yemen
Yemen
-
 Zambia
-
 Zimbabwe
- Forex
- Crypto
