
-8.97% for Ethena — persistent selling pressure and failed support breaks

Ethena (ENA) is currently trading at $0.2507, representing a daily decline of 8.97%. The asset remains firmly below key moving averages, with persistent seller pressure confirmed as it holds under the MA-20 ($0.2671), MA-50 ($0.3212), and MA-200 ($0.4589).
ENA price prediction
Current price:
$ 0.0829
0.003
3.72%
Real-time Data
18:37
Daily range
0.0784
 0.0838
Weekly range
0.0782
0.0864
Loading...
Highlights
- Ethena contributors withdrew 1.59 billion ENA (worth approximately $443 million) from Coinbase Prime, signaling major on-chain asset reallocation.
- HyENA Trade, a perpetual futures exchange utilizing Ethena's USDe as exclusive collateral, launched mainnet operations on December 9, 2025.
- The HyENA platform offers a 50% trading fee revenue share for Ethena participants, expected to expand USDe demand and ecosystem integration.
Large token withdrawal and new futures launch as ecosystem expands
The Ethena ecosystem recently saw a significant on-chain movement, as contributors withdrew 1.59 billion ENA (valued at approximately $443 million) from Coinbase Prime. In addition, HyENA Trade, a perpetual futures exchange using Ethena’s USDe as exclusive collateral, launched on mainnet on December 9, 2025. The new platform, operating with a 50% trading fee revenue share for Ethena participants, is expected to expand ecosystem integration and increase demand for USDe.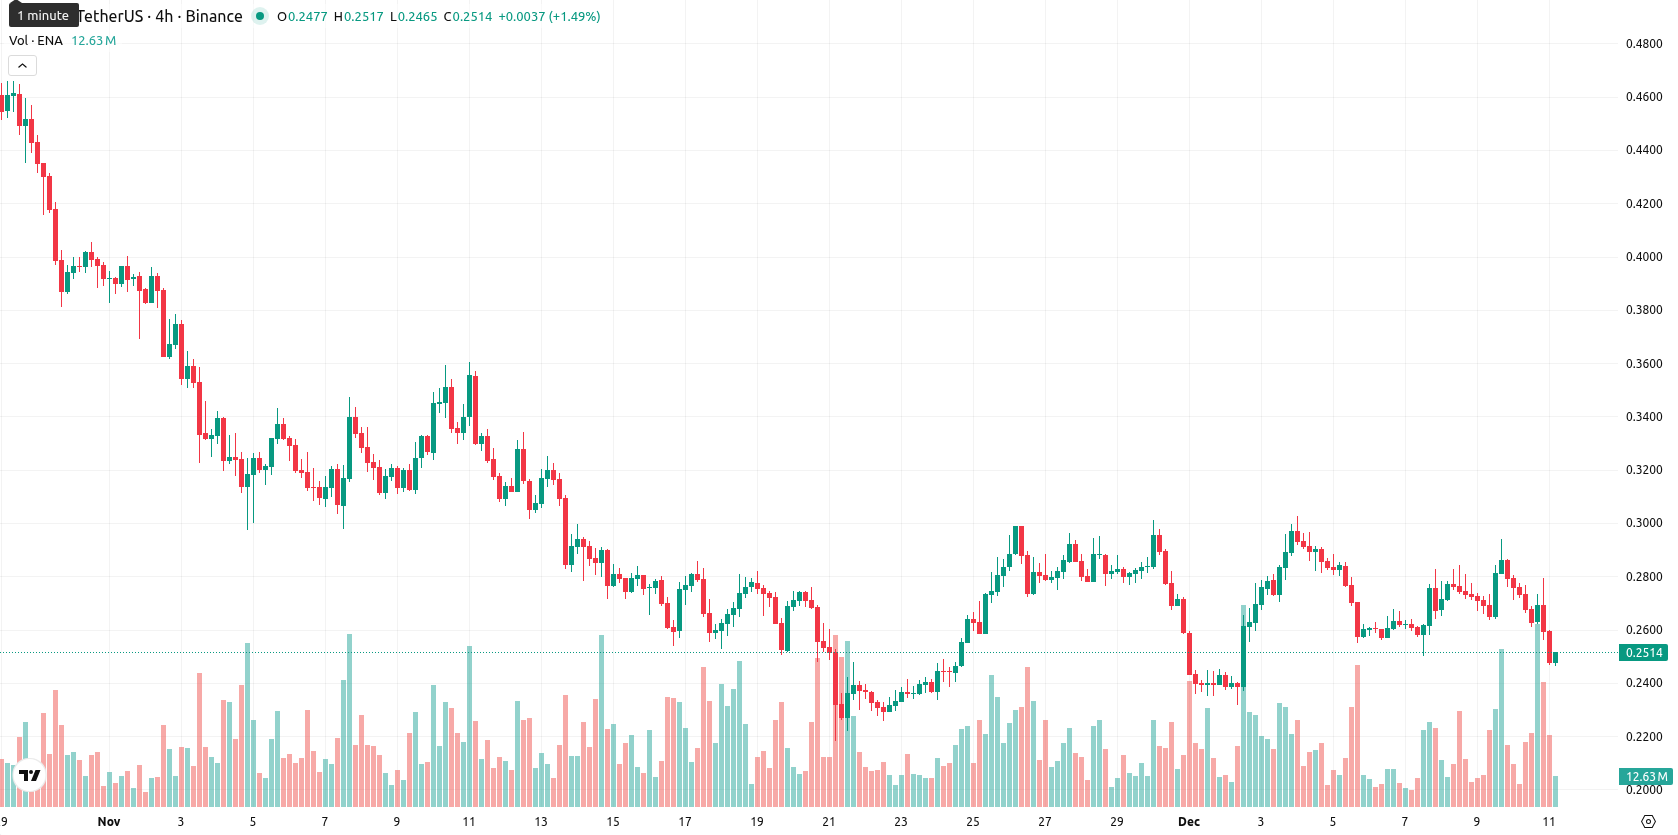
Entrenched bearish momentum with resistance flipping and weak support
Technical conditions remain decisively bearish: ENA trades well below its short-term MA-20 ($0.2671), MA-50 ($0.3212), and long-term MA-200 ($0.4589), confirming entrenched selling pressure. The closest dynamic support, set by the Ichimoku Kijun, stands at $0.2600 and has now turned into immediate resistance. There is no notable cross between MA-50 and MA-200, reinforcing the downtrend. Daily momentum indicators also align with this negative assessment: MACD signals a strong sell, ADX at 29.99 points to a pronounced downward trend, RSI at 43.3 suggests a continued bearish bias, and the Stochastic RSI flags ongoing downward momentum. CCI remains neutral, while Bull/Bear Power is marginally positive but intraday direction appears weak. The Awesome Oscillator's neutral stance does not contradict the broader negative trend, and price action near the session low with high volatility further highlights persistent seller dominance.Sideways consolidation expected as upside probability remains limited
Over the next five trading days, ENA is expected to fluctuate within a typical volatility band of $0.2250–$0.2550 relative to current levels. The probability of a significant upward move remains very low, under 20%, given strong sell signals from weekly and daily RSI, MACD, and moving averages. The base case is for ENA to consolidate sideways between $0.2250 and $0.2550. A bullish outcome would require a confirmed breakout above $0.2600, while a sustained drop below $0.2250 could accelerate further declines.
Anton Kharitonov, expert at Traders Union, remains decidedly cautious on ENA in the current environment. He notes that persistent selling pressure keeps the price below all key moving averages, while momentum indicators reinforce a negative technical setup. Recent on-chain developments and the HyENA Trade launch have yet to shift sentiment or reverse the entrenched downtrend. "As long as ENA trades below the $0.2600 resistance, my base case is sideways to lower — upside risk is limited and I remain defensive."
Previously it was reported that ENA faced strong downside pressure, trading below all major moving averages with bearish momentum indicated by key oscillators such as MACD, ADX, and a mixed RSI profile. The Ichimoku Kijun level provided immediate dynamic support while volatility remained high and sellers dominated, as today’s session shows a sharp decline and persistent negative sentiment.
Source of Data:
ENA Price Analysis by TU
The analysis is based on a proprietary model combining technical, on-chain, and expert data. Not investment advice. See
methodology
The information is based on forecasts and does not constitute investment advice or a guarantee of future results. Market conditions may change. See our Disclaimer and Editorial Integrity for details.
Subscribe to TU news

Did you like the article?


Weekly Top Bonuses

Top News


Top 5 companies for you

United States
-
 Afghanistan
-
 Albania
-
 Algeria
-
 Angola
-
 Argentina
-
 Armenia
-
 Australia
-
 Austria
-
 Azerbaijan
-
 Bahamas
-
 Bahrain
-
 Bangladesh
-
 Belarus
-
 Belgium
-
 Bolivia
-
 Botswana
-
 Brazil
-
 Brunei
-
 Bulgaria
-
 Cambodia
-
 Cameroon
-
 Canada
-
 Chile
Chile
-
 China
China
-
 Colombia
-
 Congo
Congo
-
 Costa Rica
-
 Cote d'Ivoire
-
 Croatia
-
 Cuba
Cuba
-
 Cyprus
-
 Czechia
-
 DR Congo
-
 Denmark
-
 Dominican Republic
-
 Ecuador
-
 Egypt
Egypt
-
 El Salvador
-
 Estonia
-
 Eswatini
-
 Ethiopia
-
 Finland
-
 France
-
 Georgia
-
 Germany
-
 Ghana
Ghana
-
 Greece
-
 Haiti
Haiti
-
 Hong Kong
-
 Hungary
-
 India
India
-
 Indonesia
-
 Iran, Islamic republic
-
 Iraq
Iraq
-
 Ireland
-
 Israel
-
 Italy
Italy
-
 Jamaica
-
 Japan
Japan
-
 Jordan
-
 Kazakhstan
-
 Kenya
Kenya
-
 Korea
Korea
-
 Kuwait
-
 Kyrgyzstan
-
 Laos
Laos
-
 Latvia
-
 Lebanon
-
 Lesotho
-
 Libya
Libya
-
 Lithuania
-
 Luxembourg
-
 Madagascar
-
 Malaysia
-
 Malta
Malta
-
 Mauritius
-
 Mexico
-
 Moldova
-
 Mongolia
-
 Montenegro
-
 Morocco
-
 Mozambique
-
 Myanmar
-
 Namibia
-
 Nepal
Nepal
-
 Netherlands
-
 New Zealand
-
 Nigeria
-
 North Macedonia
-
 Norway
-
 Oman
Oman
-
 Pakistan
-
 Palestine
-
 Panama
-
 Papua New Guinea
-
 Paraguay
-
 Peru
Peru
-
 Philippines
-
 Poland
-
 Portugal
-
 Puerto Rico
-
 Qatar
Qatar
-
 Reunion
-
 Romania
-
 Rwanda
-
 Saudi Arabia
-
 Serbia
-
 Singapore
-
 Slovakia
-
 Slovenia
-
 Somalia
-
 South Africa
-
 Spain
Spain
-
 Sri Lanka
-
 Sweden
-
 Switzerland
-
 Syria
Syria
-
 Taiwan
-
 Tajikistan
-
 Tanzania
-
 Thailand
-
 Trinidad and Tobago
-
 Tunisia
-
 Turkey
-
 UAE
UAE
-
 Uganda
-
 Ukraine
-
 United Kingdom
-
United States
-
 Uruguay
-
 Uzbekistan
-
 Venezuela
-
 Vietnam
-
 Yemen
Yemen
-
 Zambia
-
 Zimbabwe
- Forex
- Crypto
Live News
