
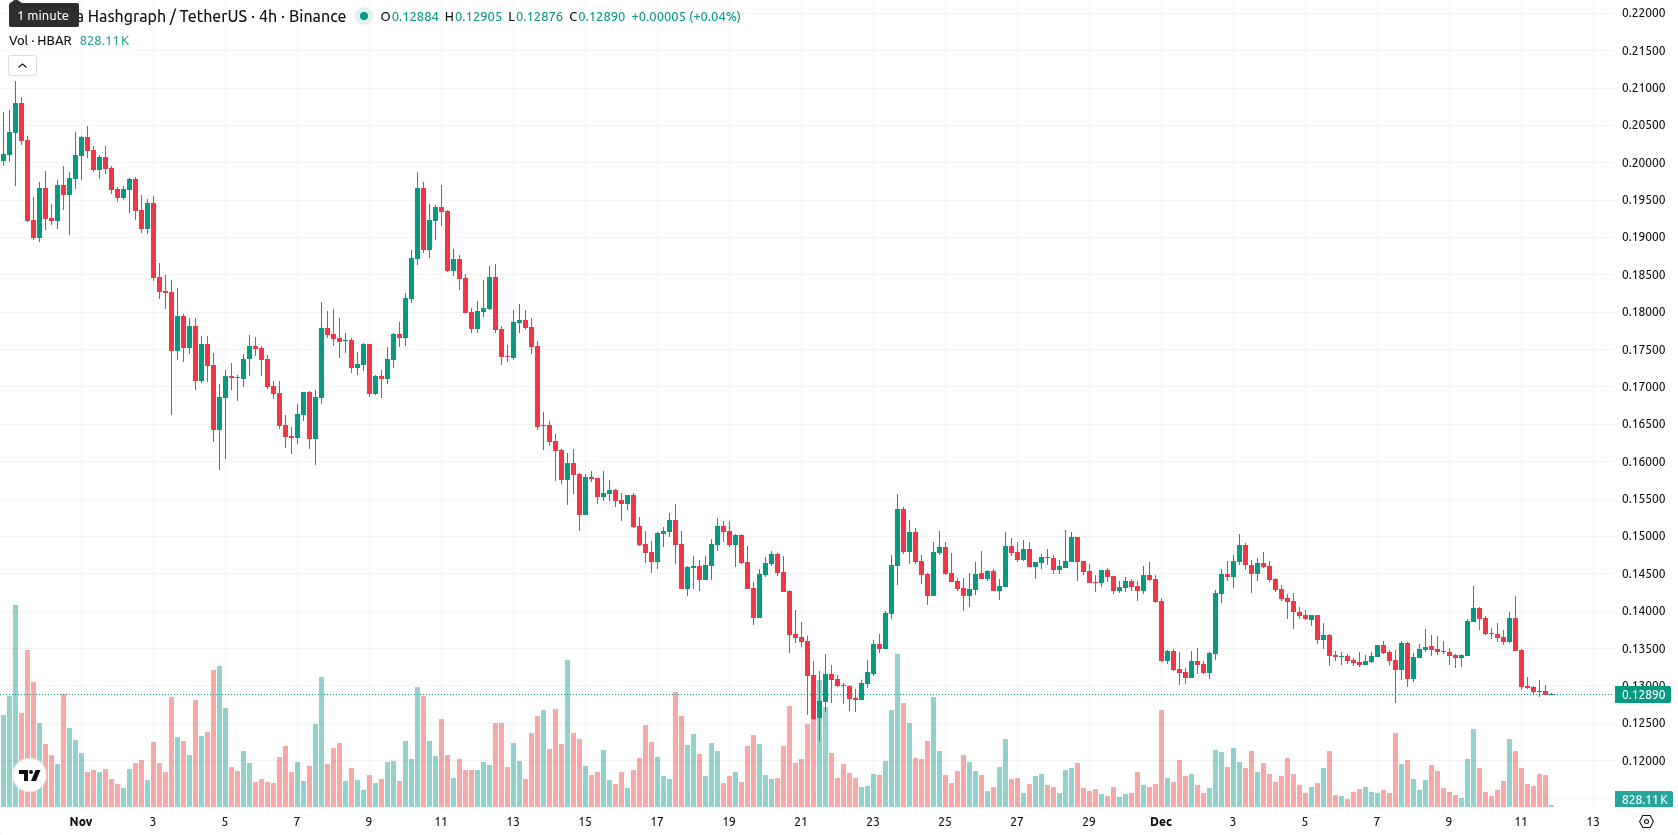
Hedera: selling momentum led to persistent price drop of 7.21%

Hedera (HBAR) is trading at $0.1287, reflecting a sharp daily loss of 7.21% and maintaining a position below its MA-20 ($0.1400), MA-50 ($0.1596), and MA-200 ($0.1969) trend lines, which signals persistent selling pressure across multiple timeframes.
Highlights
- Hedera partnered with Georgia's Ministry of Justice to move the national real estate registry onto its blockchain, reflecting significant government-level adoption.
- Hedera launched the Enterprise Adoption Team to speed up enterprise and ESG blockchain projects, targeting large organizations for increased network activity.
- The network emphasizes its carbon-negative status and transaction efficiency, supporting an ongoing rise in enterprise tokenization and institutional engagement.
Enterprise adoption expands as government deal and ESG focus drive interest
Hedera recently secured a partnership with Georgia's Ministry of Justice to transition the national real estate registry to its blockchain network, marking a significant step in government adoption of its technology. The network also launched the Hedera Enterprise Adoption Team to accelerate the rollout of enterprise and ESG-focused blockchain initiatives. Efforts continue to draw large organizations by highlighting Hedera's carbon-negative profile and robust transaction efficiency, alongside increased activity driven by enterprise tokenization and institutional interests.
Bearish momentum dominates as resistance holds and support erodes
On the technical side, HBAR finds its nearest resistance at the Ichimoku Kijun level of $0.1406, with no major support visible from moving averages at current prices. Daily momentum indicators remain bearish, as MACD and ADX both signal continued selling, and the RSI is subdued at 41.9. Stoch RSI and CCI show no clear signs of reversal, and Bull/Bear Power, while slightly positive, does not offset prevailing negative momentum. Intraday price action aligns with the overall bearish outlook, as all primary oscillators and momentum signals confirm sustained downside pressure.
Downside risk prevails as volatility bands constrain near-term outlook
Over the next five trading days, HBAR is likely to fluctuate in a typical volatility band between $0.1160 and $0.1325, given recent activity. There is a strong probability (above 80%) that the asset will continue to move lower, with sideways action as the baseline scenario. A break above resistance at $0.1406 could trigger limited upward movement, but current signals make this unlikely. Conversely, persistent declines below $0.1280 could bring a test of support at $0.1160, reinforcing the prevailing downtrend.
Previously it was reported that HBAR held a short-term bullish stance, trading above its 20-day moving average but still constrained by resistance at the 50-day and 200-day levels, with Ichimoku’s Kijun acting as a dynamic support. Despite a visible gap up and strong daily gain, daily MACD and RSI remain bearish or weak, while indicators such as the Bollinger Band Position and Stoch RSI suggest buyers remain in control for now though longer-term momentum fails to confirm this rally.


-
 Afghanistan
-
 Albania
-
 Algeria
-
 Angola
-
 Argentina
-
 Armenia
-
 Australia
-
 Austria
-
 Azerbaijan
-
 Bahamas
-
 Bahrain
-
 Bangladesh
-
 Belarus
-
 Belgium
-
 Bolivia
-
 Botswana
-
 Brazil
-
 Brunei
-
 Bulgaria
-
 Cambodia
-
 Cameroon
-
 Canada
-
 Chile
Chile
-
 China
China
-
 Colombia
-
 Congo
Congo
-
 Costa Rica
-
 Cote d'Ivoire
-
 Croatia
-
 Cuba
Cuba
-
 Cyprus
-
 Czechia
-
 DR Congo
-
 Denmark
-
 Dominican Republic
-
 Ecuador
-
 Egypt
Egypt
-
 El Salvador
-
 Estonia
-
 Eswatini
-
 Ethiopia
-
 Finland
-
 France
-
 Georgia
-
 Germany
-
 Ghana
Ghana
-
 Greece
-
 Haiti
Haiti
-
 Hong Kong
-
 Hungary
-
 India
India
-
 Indonesia
-
 Iran, Islamic republic
-
 Iraq
Iraq
-
 Ireland
-
 Israel
-
 Italy
Italy
-
 Jamaica
-
 Japan
Japan
-
 Jordan
-
 Kazakhstan
-
 Kenya
Kenya
-
 Korea
Korea
-
 Kuwait
-
 Kyrgyzstan
-
 Laos
Laos
-
 Latvia
-
 Lebanon
-
 Lesotho
-
 Libya
Libya
-
 Lithuania
-
 Luxembourg
-
 Madagascar
-
 Malaysia
-
 Malta
Malta
-
 Mauritius
-
 Mexico
-
 Moldova
-
 Mongolia
-
 Montenegro
-
 Morocco
-
 Mozambique
-
 Myanmar
-
 Namibia
-
 Nepal
Nepal
-
 Netherlands
-
 New Zealand
-
 Nigeria
-
 North Macedonia
-
 Norway
-
 Oman
Oman
-
 Pakistan
-
 Palestine
-
 Panama
-
 Papua New Guinea
-
 Paraguay
-
 Peru
Peru
-
 Philippines
-
 Poland
-
 Portugal
-
 Puerto Rico
-
 Qatar
Qatar
-
 Reunion
-
 Romania
-
 Rwanda
-
 Saudi Arabia
-
 Serbia
-
 Singapore
-
 Slovakia
-
 Slovenia
-
 Somalia
-
 South Africa
-
 Spain
Spain
-
 Sri Lanka
-
 Sweden
-
 Switzerland
-
 Syria
Syria
-
 Taiwan
-
 Tajikistan
-
 Tanzania
-
 Thailand
-
 Trinidad and Tobago
-
 Tunisia
-
 Turkey
-
 UAE
UAE
-
 Uganda
-
 Ukraine
-
 United Kingdom
-
United States
-
 Uruguay
-
 Uzbekistan
-
 Venezuela
-
 Vietnam
-
 Yemen
Yemen
-
 Zambia
-
 Zimbabwe
- Forex
- Crypto
