
Solana finds short-term stability near $125 without trend shift

Solana remains under sustained pressure on Monday as the token trades near the lower end of its recent range, signaling stabilization rather than a meaningful recovery. After a sharp reversal from September highs, SOL is hovering around the $125–$127 zone, where buyers have managed to slow the decline but not reverse the broader trend.
Highlights
- Solana trades near $125 as the broader downtrend remains intact below declining EMAs.
- Momentum and spot flows point to consolidation, not accumulation, after months of selling.
- A reclaim of $130–$135 is needed to shift SOL from corrective trade into recovery mode.
The price action reflects a market attempting to find balance after months of distribution, even as higher-timeframe signals continue to favor caution. Short-term stabilization has reduced immediate downside risk, but conviction remains limited.
Trend structure shows stabilization, not reversal
On the daily chart, Solana continues to trade below its full EMA structure, underscoring the persistence of the corrective trend. The 20-day EMA near $130 has capped recent bounce attempts, while the 50-day and 100-day EMAs, clustered in the $143–$158 region, continue to slope lower. This bearish alignment confirms that the dominant trend remains under pressure despite the recent slowdown in selling momentum.
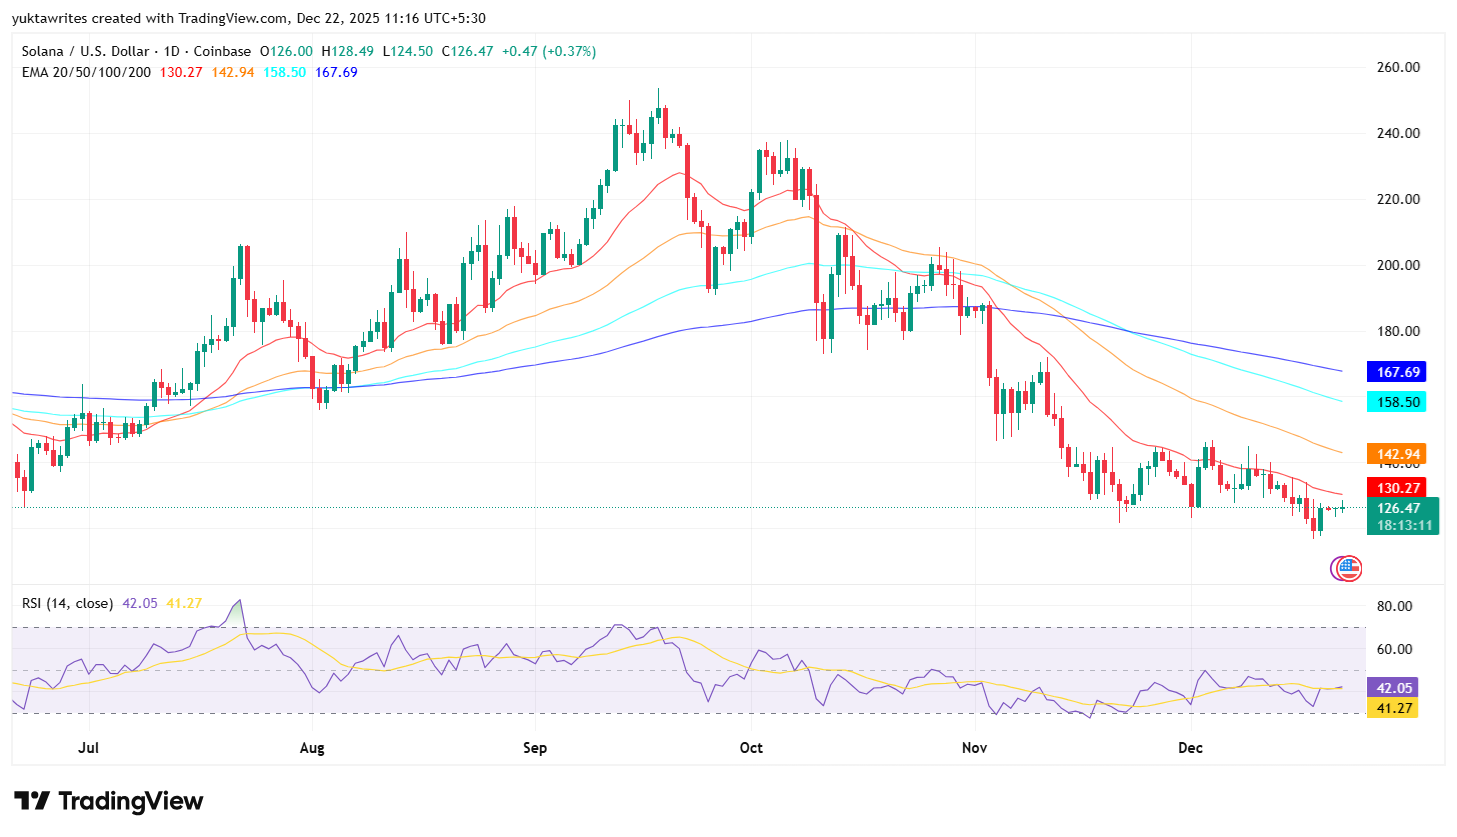
SOL price dynamic (Source: TradingView)
The broader structure highlights a decisive shift in market character since October. Solana failed to hold above its 200-day EMA earlier in the quarter, triggering a sharp selloff that reset medium-term positioning. Since that breakdown, rebounds have been shallow and consistently rejected beneath declining resistance. Daily candles show limited follow-through on upside sessions, suggesting that rallies are being used to reduce exposure rather than establish new long positions.
Momentum indicators reinforce this view. Daily RSI is hovering in the low-40s, reflecting weak underlying demand and a market struggling to regain neutral momentum. While RSI is no longer deeply oversold, it has repeatedly failed to reclaim the 50 level, which typically separates corrective bounces from trend recovery. The absence of bullish divergence between price and momentum further reduces the probability of an imminent higher-timeframe reversal.
Flows and intraday action offer only tentative relief
Spot flow data adds important context to Solana’s price behavior. Over recent months, the asset has recorded persistent net outflows from exchanges, underscoring ongoing distribution pressure. Although the latest reading shows a modest positive netflow, it remains small relative to the scale of prior outflows and does little to materially shift supply dynamics. This mirrors the chart structure, where buyers appear selective rather than aggressive.
Intraday signals are slightly more constructive but remain fragile. On the 30-minute chart, SOL has held above short-term support near $124–$125, with Supertrend providing a near-term floor and Parabolic SAR flipping beneath price. This has allowed the market to consolidate rather than slide further, but upside progress has stalled repeatedly near $127–$128. The narrow range reflects balance at depressed levels, not the kind of expansion typically associated with trend reversals.
From a structural standpoint, key levels are now well defined. The $124 area represents immediate support, and a sustained break below it would expose downside risk toward the low-$120s, where prior intraday demand briefly emerged. On the upside, $130 remains the first meaningful barrier, aligned with the descending 20-day EMA. A clean daily close above that region, followed by acceptance toward $135, would be required to signal that Solana is transitioning from consolidation into a recovery phase.
Broader context keeps bias cautious
The technical picture aligns with the broader narrative discussed previously, where Solana’s underperformance has been driven by prolonged distribution and the failure to attract sustained inflows during market-wide rallies. That framework remains intact. While downside momentum has cooled and volatility has compressed, the market has yet to demonstrate the characteristics of durable accumulation.
Macro conditions and sector rotation within crypto have also played a role. Capital has remained concentrated in assets with clearer catalysts or stronger relative strength, leaving SOL vulnerable to supply overhang from earlier buyers. Until flows improve and price can reclaim key moving averages, confidence in a sustained upside move is likely to remain limited.
In summary, Solana is transitioning from active decline into short-term stabilization, but the higher-timeframe structure remains bearish. The combination of declining EMAs, subdued momentum, and lingering spot outflows suggests the market is still in a corrective phase rather than building a durable base. As long as SOL remains capped below the $130–$135 resistance zone, rallies are likely to remain corrective in nature, with the balance of risk skewed toward continued range-bound trade or renewed downside rather than a decisive trend reversal.


-
 Afghanistan
-
 Albania
-
 Algeria
-
 Angola
-
 Argentina
-
 Armenia
-
 Australia
-
 Austria
-
 Azerbaijan
-
 Bahamas
-
 Bahrain
-
 Bangladesh
-
 Belarus
-
 Belgium
-
 Bolivia
-
 Botswana
-
 Brazil
-
 Brunei
-
 Bulgaria
-
 Cambodia
-
 Cameroon
-
 Canada
-
 Chile
Chile
-
 China
China
-
 Colombia
-
 Congo
Congo
-
 Costa Rica
-
 Cote d'Ivoire
-
 Croatia
-
 Cuba
Cuba
-
 Cyprus
-
 Czechia
-
 DR Congo
-
 Denmark
-
 Dominican Republic
-
 Ecuador
-
 Egypt
Egypt
-
 El Salvador
-
 Estonia
-
 Eswatini
-
 Ethiopia
-
 Finland
-
 France
-
 Georgia
-
 Germany
-
 Ghana
Ghana
-
 Greece
-
 Haiti
Haiti
-
 Hong Kong
-
 Hungary
-
 India
India
-
 Indonesia
-
 Iran, Islamic republic
-
 Iraq
Iraq
-
 Ireland
-
 Israel
-
 Italy
Italy
-
 Jamaica
-
 Japan
Japan
-
 Jordan
-
 Kazakhstan
-
 Kenya
Kenya
-
 Korea
Korea
-
 Kuwait
-
 Kyrgyzstan
-
 Laos
Laos
-
 Latvia
-
 Lebanon
-
 Lesotho
-
 Libya
Libya
-
 Lithuania
-
 Luxembourg
-
 Madagascar
-
 Malaysia
-
 Malta
Malta
-
 Mauritius
-
 Mexico
-
 Moldova
-
 Mongolia
-
 Montenegro
-
 Morocco
-
 Mozambique
-
 Myanmar
-
 Namibia
-
 Nepal
Nepal
-
 Netherlands
-
 New Zealand
-
 Nigeria
-
 North Macedonia
-
 Norway
-
 Oman
Oman
-
 Pakistan
-
 Palestine
-
 Panama
-
 Papua New Guinea
-
 Paraguay
-
 Peru
Peru
-
 Philippines
-
 Poland
-
 Portugal
-
 Puerto Rico
-
 Qatar
Qatar
-
 Reunion
-
 Romania
-
 Rwanda
-
 Saudi Arabia
-
 Serbia
-
 Singapore
-
 Slovakia
-
 Slovenia
-
 Somalia
-
 South Africa
-
 Spain
Spain
-
 Sri Lanka
-
 Sweden
-
 Switzerland
-
 Syria
Syria
-
 Taiwan
-
 Tajikistan
-
 Tanzania
-
 Thailand
-
 Trinidad and Tobago
-
 Tunisia
-
 Turkey
-
 UAE
UAE
-
 Uganda
-
 Ukraine
-
 United Kingdom
-
United States
-
 Uruguay
-
 Uzbekistan
-
 Venezuela
-
 Vietnam
-
 Yemen
Yemen
-
 Zambia
-
 Zimbabwe
- Forex
- Crypto
