
Solana consolidates near $125 after multi-month correction

Solana price is trading in a fragile consolidation phase on Tuesday after a sharp multi-month correction erased much of its earlier 2025 advance. At the time of writing, SOL is holding near the $124 to $126 area, a zone that has repeatedly acted as short-term support but has not attracted convincing follow-through buying.
Highlights
- Solana is consolidating near $124–$126 after a multi-month correction erased much of its 2025 gains.
- Persistent spot outflows and crowded long positioning continue to weigh on recovery attempts.
- Key resistance at $130 and $142 must be reclaimed to shift the broader trend outlook.
Price behavior over recent weeks suggests balance rather than strength. Selling pressure has eased compared with the aggressive declines seen earlier in the quarter, but buyers have remained selective. Each attempt to push higher has been met with renewed supply, keeping Solana trapped in a narrow range and reinforcing the sense that the market is reassessing value rather than positioning for a new trend.
Daily chart damage keeps Solana capped below key trend levels
The daily chart confirms the extent of the technical damage. Solana is trading below all major exponential moving averages, with the 20-day EMA near $130 and the 50-day EMA around $142 acting as firm overhead resistance. The 100- and 200-day EMAs, clustered above $155, define the longer-term trend barrier and underscore how far price has slipped from its earlier bullish structure.
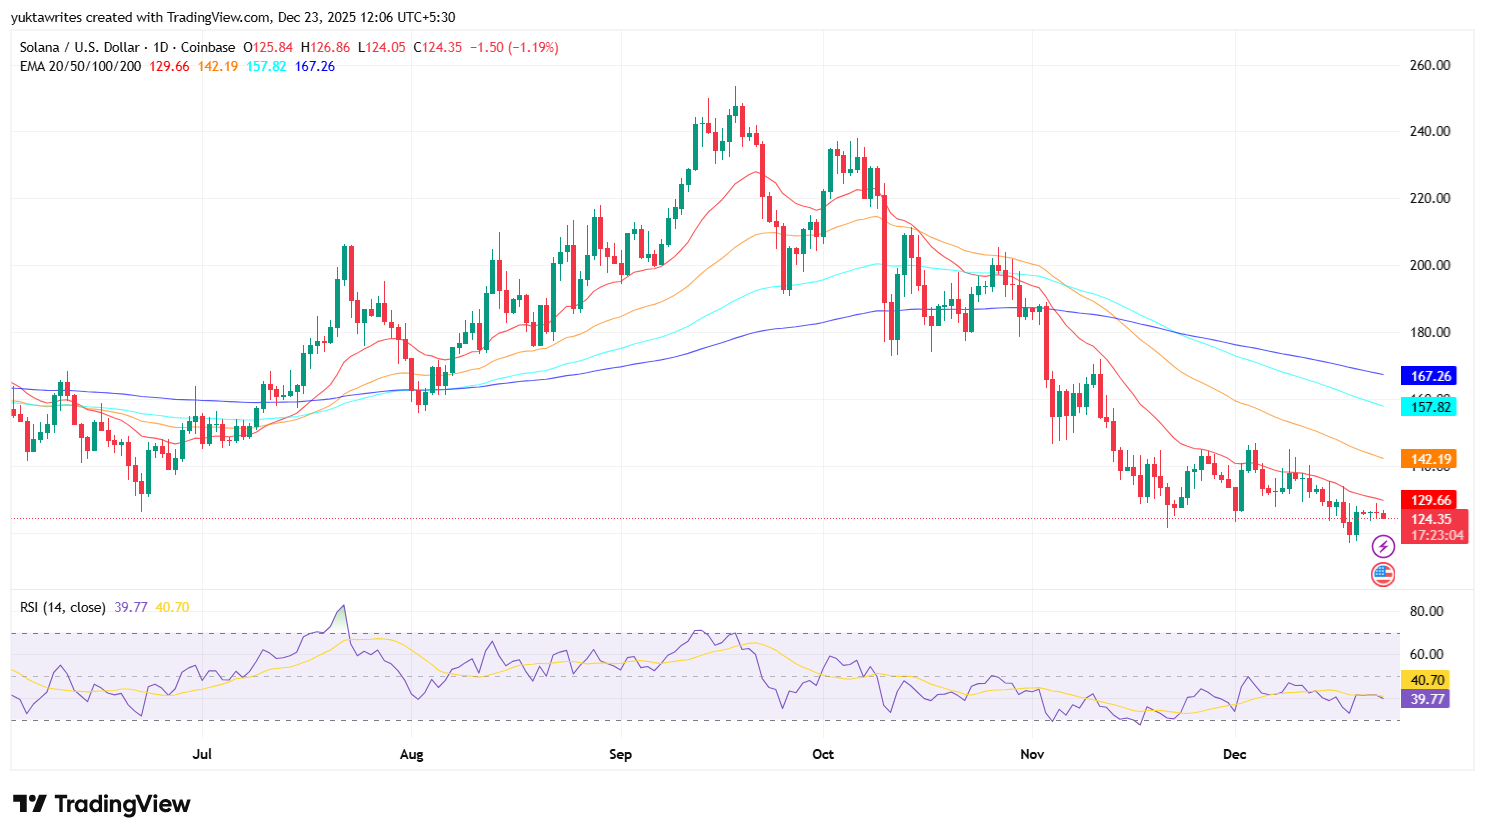
SOL price dynamics (Source: TradingView)
Momentum indicators reinforce this assessment. The daily RSI is hovering just below the neutral 40 to 45 zone, reflecting weak buying pressure without reaching deeply oversold conditions. This positioning often accompanies prolonged consolidation or slow grinding phases rather than sharp reversals. Importantly, there is no clear bullish divergence developing, which limits the case for an imminent trend shift.
From a level perspective, the $122 to $124 zone represents immediate support. This area has absorbed multiple selloffs and now carries growing significance. A decisive break below it would expose the psychological $115 level, followed by a deeper retracement toward the low $100s, where prior demand emerged earlier in the year. On the upside, Solana must reclaim $130 to stabilize sentiment, with $142 marking the first meaningful test of trend recovery.
Spot outflows and derivatives imbalance shape sentiment
Spot flow data highlights the core tension underlying Solana’s price action. Since October, the asset has experienced persistent net outflows, with several large distribution spikes aligning with sharp price declines. Although the magnitude of outflows has moderated in recent sessions, inflows remain shallow and inconsistent. This pattern suggests that long-term holders are no longer accumulating at scale, while short-term participants remain cautious about committing fresh capital.
Historically, sustained upside phases in Solana have coincided with extended periods of positive net flows, signaling broad participation and confidence in higher prices. That condition is currently absent, leaving the market vulnerable to renewed selling whenever rallies stall.
Derivatives data paints a more complex picture. Futures open interest has increased modestly even as price has drifted lower, indicating fresh positioning rather than simple risk reduction. However, positioning remains heavily skewed toward longs, particularly among top traders on major exchanges. This imbalance has already resulted in repeated long liquidations during downside moves, as reflected in recent 12-hour and 24-hour liquidation data.
The mismatch between bullish positioning and weak price confirmation creates a fragile setup. If support levels give way, additional long unwinds could accelerate downside moves, even in the absence of a broader risk-off shock.
Technical structure remains corrective, not constructive
Lower-timeframe charts underline the lack of short-term control by buyers. On the 30-minute chart, Solana remains capped below Supertrend and Parabolic SAR resistance near the $126 to $127 region. A series of lower highs has formed over the past two sessions, and each bounce has been met with selling pressure. This behavior suggests that short-term traders are using rallies to exit positions rather than initiate new exposure.
Previously discussed, Solana has been transitioning away from its high-momentum profile into a more selective, balance-driven market. That shift is evident in the way volatility has compressed and participation has thinned.
Overall, Solana remains in a corrective phase defined by persistent spot outflows, crowded long positioning, and a bearish moving-average structure. While downside momentum has slowed, the market has not yet attracted the sustained inflows needed to support a durable recovery. Until price can reclaim key daily averages alongside improving spot flows, rallies are likely to remain tactical rather than trend-defining, with risk skewed toward sideways consolidation or renewed downside as traders await a decisive catalyst.


-
 Afghanistan
-
 Albania
-
 Algeria
-
 Angola
-
 Argentina
-
 Armenia
-
 Australia
-
 Austria
-
 Azerbaijan
-
 Bahamas
-
 Bahrain
-
 Bangladesh
-
 Belarus
-
 Belgium
-
 Bolivia
-
 Botswana
-
 Brazil
-
 Brunei
-
 Bulgaria
-
 Cambodia
-
 Cameroon
-
 Canada
-
 Chile
Chile
-
 China
China
-
 Colombia
-
 Congo
Congo
-
 Costa Rica
-
 Cote d'Ivoire
-
 Croatia
-
 Cuba
Cuba
-
 Cyprus
-
 Czechia
-
 DR Congo
-
 Denmark
-
 Dominican Republic
-
 Ecuador
-
 Egypt
Egypt
-
 El Salvador
-
 Estonia
-
 Eswatini
-
 Ethiopia
-
 Finland
-
 France
-
 Georgia
-
 Germany
-
 Ghana
Ghana
-
 Greece
-
 Haiti
Haiti
-
 Hong Kong
-
 Hungary
-
 India
India
-
 Indonesia
-
 Iran, Islamic republic
-
 Iraq
Iraq
-
 Ireland
-
 Israel
-
 Italy
Italy
-
 Jamaica
-
 Japan
Japan
-
 Jordan
-
 Kazakhstan
-
 Kenya
Kenya
-
 Korea
Korea
-
 Kuwait
-
 Kyrgyzstan
-
 Laos
Laos
-
 Latvia
-
 Lebanon
-
 Lesotho
-
 Libya
Libya
-
 Lithuania
-
 Luxembourg
-
 Madagascar
-
 Malaysia
-
 Malta
Malta
-
 Mauritius
-
 Mexico
-
 Moldova
-
 Mongolia
-
 Montenegro
-
 Morocco
-
 Mozambique
-
 Myanmar
-
 Namibia
-
 Nepal
Nepal
-
 Netherlands
-
 New Zealand
-
 Nigeria
-
 North Macedonia
-
 Norway
-
 Oman
Oman
-
 Pakistan
-
 Palestine
-
 Panama
-
 Papua New Guinea
-
 Paraguay
-
 Peru
Peru
-
 Philippines
-
 Poland
-
 Portugal
-
 Puerto Rico
-
 Qatar
Qatar
-
 Reunion
-
 Romania
-
 Rwanda
-
 Saudi Arabia
-
 Serbia
-
 Singapore
-
 Slovakia
-
 Slovenia
-
 Somalia
-
 South Africa
-
 Spain
Spain
-
 Sri Lanka
-
 Sweden
-
 Switzerland
-
 Syria
Syria
-
 Taiwan
-
 Tajikistan
-
 Tanzania
-
 Thailand
-
 Trinidad and Tobago
-
 Tunisia
-
 Turkey
-
 UAE
UAE
-
 Uganda
-
 Ukraine
-
 United Kingdom
-
United States
-
 Uruguay
-
 Uzbekistan
-
 Venezuela
-
 Vietnam
-
 Yemen
Yemen
-
 Zambia
-
 Zimbabwe
- Forex
- Crypto
