
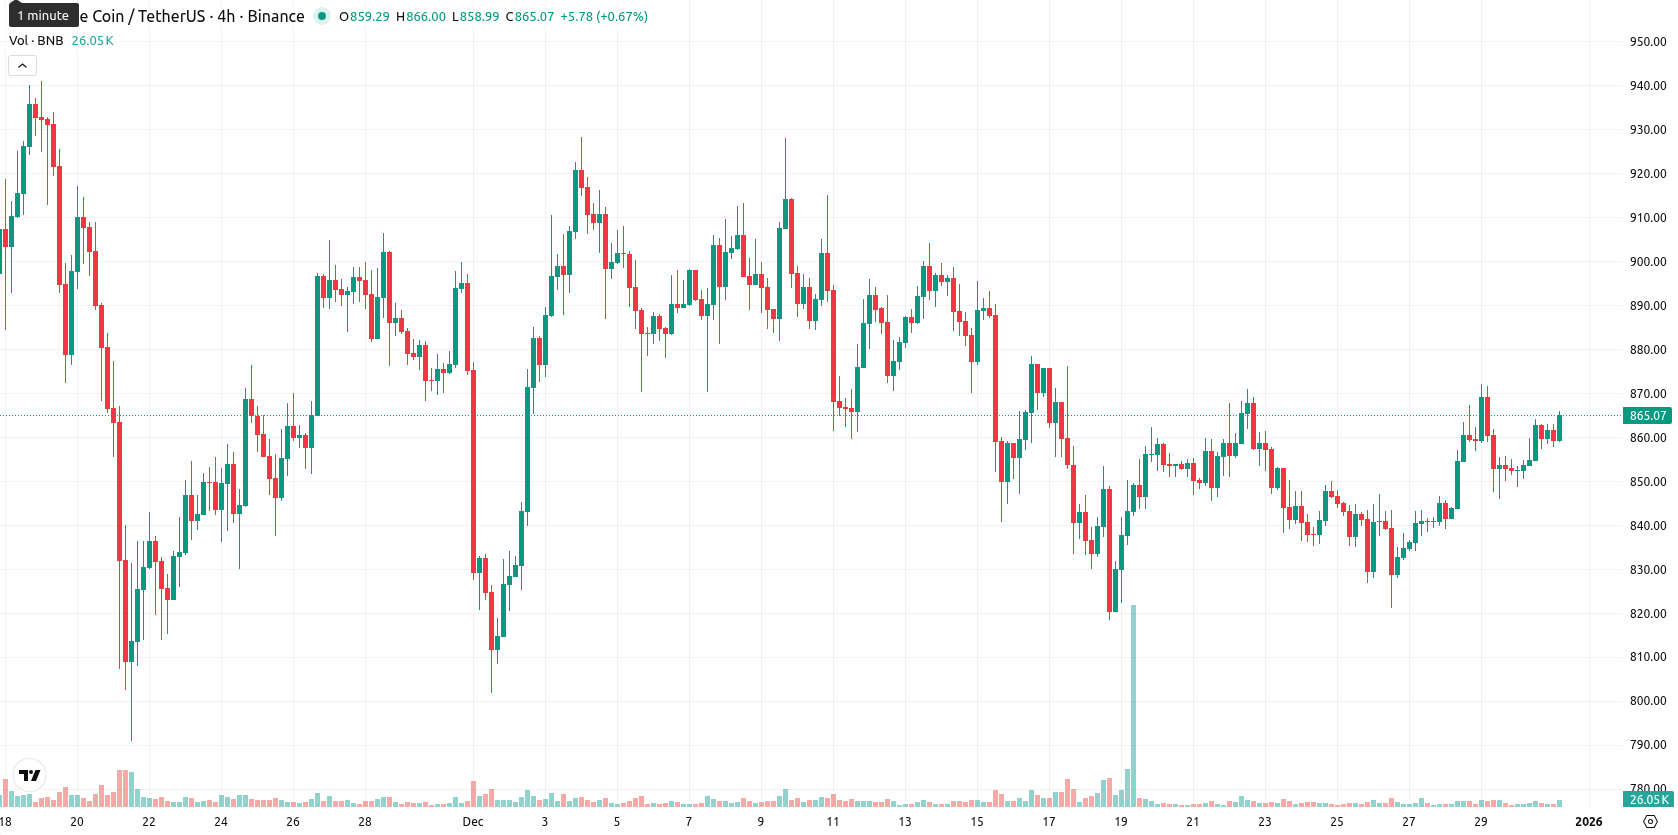
Binance Coin price prediction: Will resistance at $873 cap this rally? BNB up 1.57%

Binance Coin (BNB) is trading at $865.10, above its MA-20 ($857.50) and just below MA-50 ($878.10), with the MA-200 ($883.30) acting as key resistance. This position signals short-term bullish momentum, although BNB remains constrained by medium- and long-term moving averages.
Highlights
- BNB trades at $865.10, above MA-20 ($857.50) but below MA-50 ($878.10) and MA-200 ($883.30), signaling short-term bullish momentum amid longer-term resistance.
- Momentum indicators are mixed: MACD shows strong bearish momentum, RSI at 48.8 is neutral, and both BBP and Stoch RSI indicate overbought conditions with possible buyer exhaustion.
- Five-day outlook suggests BNB fluctuates between $832 and $882, with over 80% probability for an upward move given weekly momentum Buy signals.
Diverging momentum signals as resistance caps upside potential
BNB’s technical setup shows support near MA-20 and overhead resistance from both the MA-50 and MA-200, with the Ichimoku Kijun at $873.20 acting as dynamic resistance. Daily indicators are mixed: ADX points to weakening trend strength, MACD shows prevailing bearish momentum, and both RSI (48.8) and CCI are neutral. Bull/Bear Power (BBP) and Stoch RSI highlight overbought readings, signaling short-term buyer dominance but also possible exhaustion, while the Awesome Oscillator remains neutral and price action is clustered toward the upper intraday range amid moderate volatility.
High breakout risk as bullish signals cluster amid volatility
Over the next five trading days, BNB is likely to fluctuate within a typical volatility band between $832 and $882. The probability of an upward move is high (>80%) due to a cluster of Buy signals from weekly momentum indicators. The baseline scenario is sideways between support at $857 and resistance near $873; a bullish breakout above $873 – $878 could target $882 or higher, while sustained weakness below $857 may open the way toward $832.
Previously it was reported that Binance Coin (BNB) is trading below its 20-, 50-, and 200-day moving averages, sustaining bearish momentum as confirmed by negative MACD, RSI, and CCI readings, while short-term support holds in the $849–$853 zone and resistance is seen near $873. Despite incremental ecosystem growth from Oracle integration, the broad technical setup favors sideways to slightly negative price action within the $825–$875 range, with limited prospects for a sustained rally unless bullish momentum improves.


-
 Afghanistan
-
 Albania
-
 Algeria
-
 Angola
-
 Argentina
-
 Armenia
-
 Australia
-
 Austria
-
 Azerbaijan
-
 Bahamas
-
 Bahrain
-
 Bangladesh
-
 Belarus
-
 Belgium
-
 Bolivia
-
 Botswana
-
 Brazil
-
 Brunei
-
 Bulgaria
-
 Cambodia
-
 Cameroon
-
 Canada
-
 Chile
Chile
-
 China
China
-
 Colombia
-
 Congo
Congo
-
 Costa Rica
-
 Cote d'Ivoire
-
 Croatia
-
 Cuba
Cuba
-
 Cyprus
-
 Czechia
-
 DR Congo
-
 Denmark
-
 Dominican Republic
-
 Ecuador
-
 Egypt
Egypt
-
 El Salvador
-
 Estonia
-
 Eswatini
-
 Ethiopia
-
 Finland
-
 France
-
 Georgia
-
 Germany
-
 Ghana
Ghana
-
 Greece
-
 Haiti
Haiti
-
 Hong Kong
-
 Hungary
-
 India
India
-
 Indonesia
-
 Iran, Islamic republic
-
 Iraq
Iraq
-
 Ireland
-
 Israel
-
 Italy
Italy
-
 Jamaica
-
 Japan
Japan
-
 Jordan
-
 Kazakhstan
-
 Kenya
Kenya
-
 Korea
Korea
-
 Kuwait
-
 Kyrgyzstan
-
 Laos
Laos
-
 Latvia
-
 Lebanon
-
 Lesotho
-
 Libya
Libya
-
 Lithuania
-
 Luxembourg
-
 Madagascar
-
 Malaysia
-
 Malta
Malta
-
 Mauritius
-
 Mexico
-
 Moldova
-
 Mongolia
-
 Montenegro
-
 Morocco
-
 Mozambique
-
 Myanmar
-
 Namibia
-
 Nepal
Nepal
-
 Netherlands
-
 New Zealand
-
 Nigeria
-
 North Macedonia
-
 Norway
-
 Oman
Oman
-
 Pakistan
-
 Palestine
-
 Panama
-
 Papua New Guinea
-
 Paraguay
-
 Peru
Peru
-
 Philippines
-
 Poland
-
 Portugal
-
 Puerto Rico
-
 Qatar
Qatar
-
 Reunion
-
 Romania
-
 Rwanda
-
 Saudi Arabia
-
 Serbia
-
 Singapore
-
 Slovakia
-
 Slovenia
-
 Somalia
-
 South Africa
-
 Spain
Spain
-
 Sri Lanka
-
 Sweden
-
 Switzerland
-
 Syria
Syria
-
 Taiwan
-
 Tajikistan
-
 Tanzania
-
 Thailand
-
 Trinidad and Tobago
-
 Tunisia
-
 Turkey
-
 UAE
UAE
-
 Uganda
-
 Ukraine
-
 United Kingdom
-
United States
-
 Uruguay
-
 Uzbekistan
-
 Venezuela
-
 Vietnam
-
 Yemen
Yemen
-
 Zambia
-
 Zimbabwe
- Forex
- Crypto
