
Steady price for Pepe — sideways action dominates amid strong selling signals

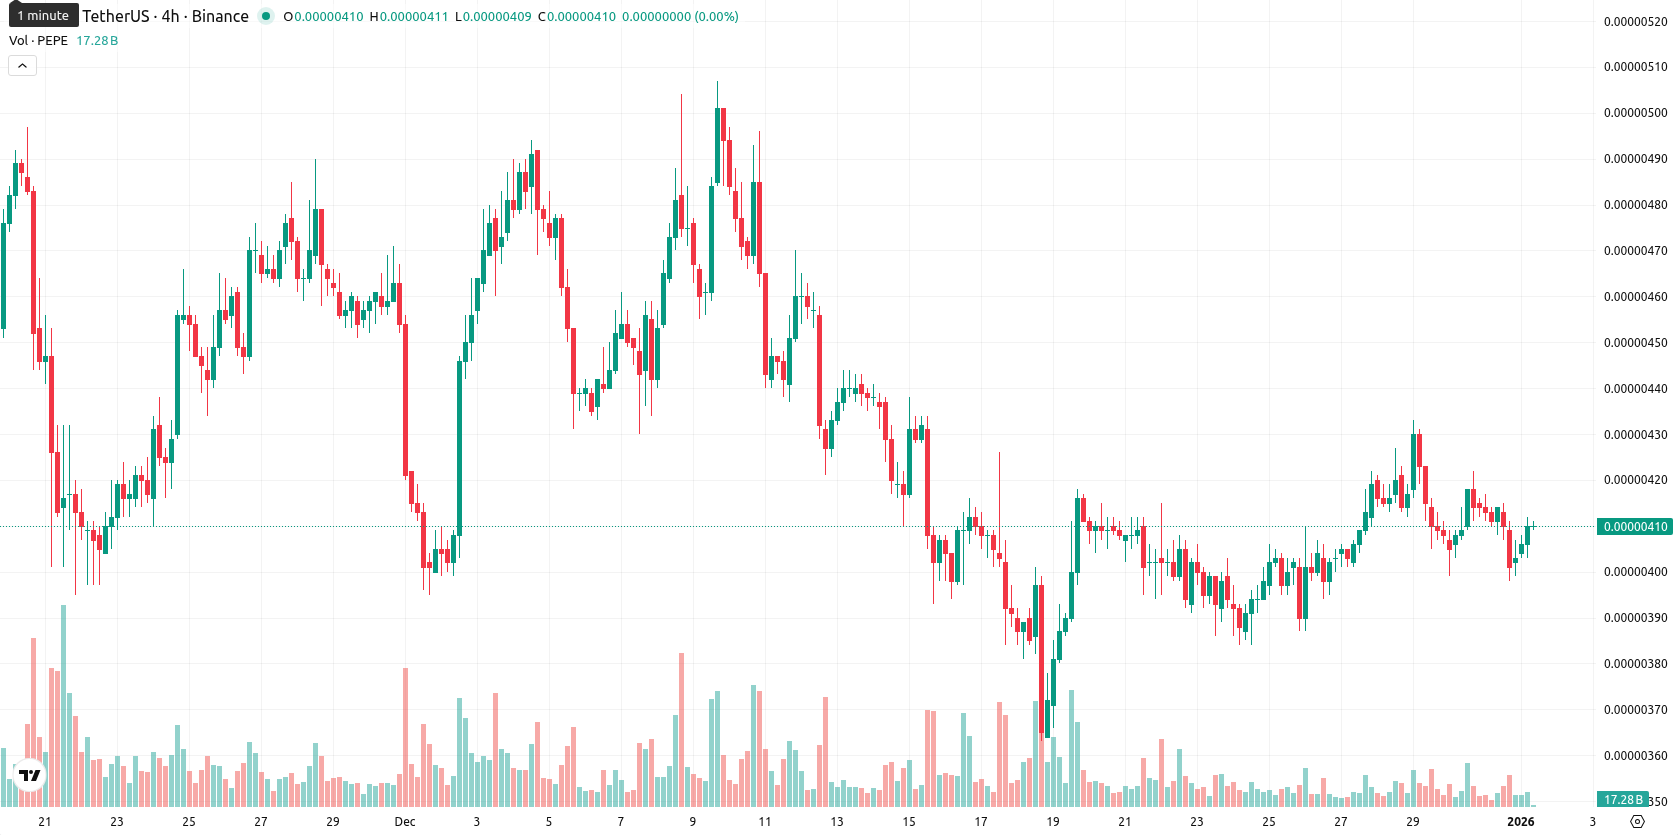
Pepe (PEPE) is currently trading at $0.0000041, which is slightly above the MA-20 ($0.00000407) but remains below both the MA-50 ($0.00000443) and MA-200 ($0.00000848), signaling weak short-term support with persistent medium- and long-term bearish pressure.
Highlights
- Pepe maintains a market capitalization of approximately $1.7 billion, supported by continued active trading and speculation in meme coin segments.
- Pepe's liquidity remains closely tied to institutional capital flows and ETF trends, making it sensitive to shifts impacting speculative digital assets.
- No changes have been reported in Pepe's core ecosystem or regulatory status, and current attention remains on its comparative role among meme coins.
Institutional flows and ETF trends steer meme coin speculation
Pepe continues to be actively traded and discussed as a meme coin, with the market capitalization recently cited at approximately $1.7 billion. Liquidity dynamics for Pepe are closely linked to shifts in institutional capital and ETF trends, which can influence speculative assets. No changes to its core ecosystem or regulatory status have been reported, with recent attention remaining on the asset’s role among meme coins.
Bearish momentum and low volatility amid tightening technical boundaries
The nearest dynamic resistance is marked by the Kijun level at $0.00000435, while MA-20 serves as immediate support. Momentum indicators show a dominant bearish setup, with MACD and ADX on daily suggesting strong selling pressure. The RSI (43.85) and Stochastic RSI (Strong Sell) are both in a bearish stance, though not yet in oversold territory, and CCI stays neutral, reflecting lackluster buying interest. Bull/Bear Power (BBP) tips toward buyer activity intraday, indicating some countertrend attempts, but with daily movement down 0.24%, no gap at the open, and price parked near the session high within a very narrow range, intraday volatility appears low. This pattern points to sideways consolidation with slight bearish undertones, as momentum and oscillators occasionally diverge, but the daily drift aligns with broad selling signals.
Downside risk heightened as narrow range constrains breakout odds
Over the next five trading days, a typical volatility band is expected between $0.00000393 and $0.00000413. Probability of a near-term price increase is very low (less than 20%), while the likelihood of a decrease is much higher given the weak weekly and daily signals. The baseline scenario anticipates PEPE trading sideways within this tight corridor. A bullish scenario would require a break above $0.00000435 resistance, while a bearish breakdown could see the price slip below $0.00000400 support, confirming further downward extension.
Previously it was reported that Pepe is consolidating just above its short-term moving averages and faces medium-term resistance, with the long-term trend remaining bearish while large holder selling continues to weigh on sentiment amid sector rotations. Despite some intraday bullish attempts, momentum and oscillator readings remain mixed-to-negative, suggesting limited breakout potential and a downside bias within a narrow trading range between immediate support and resistance.


Latest PEPE/USD News


-
 Afghanistan
-
 Albania
-
 Algeria
-
 Angola
-
 Argentina
-
 Armenia
-
 Australia
-
 Austria
-
 Azerbaijan
-
 Bahamas
-
 Bahrain
-
 Bangladesh
-
 Belarus
-
 Belgium
-
 Bolivia
-
 Botswana
-
 Brazil
-
 Brunei
-
 Bulgaria
-
 Cambodia
-
 Cameroon
-
 Canada
-
 Chile
Chile
-
 China
China
-
 Colombia
-
 Congo
Congo
-
 Costa Rica
-
 Cote d'Ivoire
-
 Croatia
-
 Cuba
Cuba
-
 Cyprus
-
 Czechia
-
 DR Congo
-
 Denmark
-
 Dominican Republic
-
 Ecuador
-
 Egypt
Egypt
-
 El Salvador
-
 Estonia
-
 Eswatini
-
 Ethiopia
-
 Finland
-
 France
-
 Georgia
-
 Germany
-
 Ghana
Ghana
-
 Greece
-
 Haiti
Haiti
-
 Hong Kong
-
 Hungary
-
 India
India
-
 Indonesia
-
 Iran, Islamic republic
-
 Iraq
Iraq
-
 Ireland
-
 Israel
-
 Italy
Italy
-
 Jamaica
-
 Japan
Japan
-
 Jordan
-
 Kazakhstan
-
 Kenya
Kenya
-
 Korea
Korea
-
 Kuwait
-
 Kyrgyzstan
-
 Laos
Laos
-
 Latvia
-
 Lebanon
-
 Lesotho
-
 Libya
Libya
-
 Lithuania
-
 Luxembourg
-
 Madagascar
-
 Malaysia
-
 Malta
Malta
-
 Mauritius
-
 Mexico
-
 Moldova
-
 Mongolia
-
 Montenegro
-
 Morocco
-
 Mozambique
-
 Myanmar
-
 Namibia
-
 Nepal
Nepal
-
 Netherlands
-
 New Zealand
-
 Nigeria
-
 North Macedonia
-
 Norway
-
 Oman
Oman
-
 Pakistan
-
 Palestine
-
 Panama
-
 Papua New Guinea
-
 Paraguay
-
 Peru
Peru
-
 Philippines
-
 Poland
-
 Portugal
-
 Puerto Rico
-
 Qatar
Qatar
-
 Reunion
-
 Romania
-
 Rwanda
-
 Saudi Arabia
-
 Serbia
-
 Singapore
-
 Slovakia
-
 Slovenia
-
 Somalia
-
 South Africa
-
 Spain
Spain
-
 Sri Lanka
-
 Sweden
-
 Switzerland
-
 Syria
Syria
-
 Taiwan
-
 Tajikistan
-
 Tanzania
-
 Thailand
-
 Trinidad and Tobago
-
 Tunisia
-
 Turkey
-
 UAE
UAE
-
 Uganda
-
 Ukraine
-
 United Kingdom
-
United States
-
 Uruguay
-
 Uzbekistan
-
 Venezuela
-
 Vietnam
-
 Yemen
Yemen
-
 Zambia
-
 Zimbabwe
- Forex
- Crypto
