
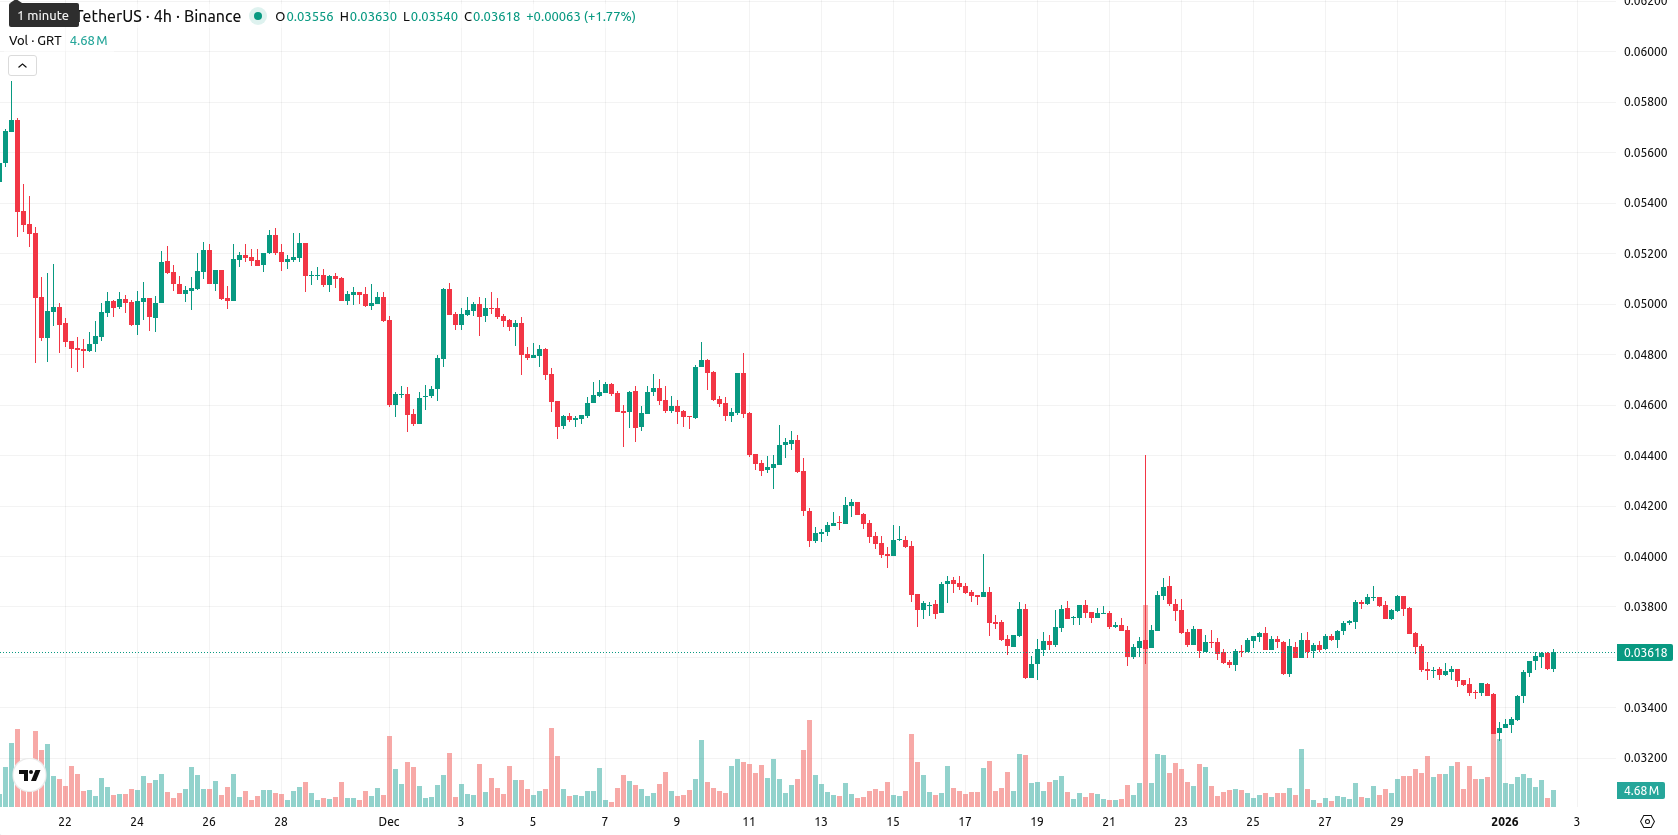
+7.25% for The Graph — bounces off local support but remains under major moving averages

The Graph (GRT) is trading at $0.035951 after gaining 7.25% intraday, but remains below the MA-20 ($0.03713135), MA-50 ($0.04503434), and MA-200 ($0.07524133). This positioning under all key moving averages highlights lingering seller dominance across short-, medium-, and long-term trends.
Highlights
- GRT is trading at $0.035951, below its MA-20, MA-50, and MA-200, indicating persistent seller dominance across all major timeframes.
- Despite a 7.25% gain from the previous close, momentum indicators like MACD and Bull/Bear Power confirm strong selling pressure and only a modest intraday rebound.
- The five-day outlook expects GRT to remain in a $0.0330–$0.0385 range, with less than 20% probability of a significant price increase based on technical signals.
Negative momentum prevails as indicators diverge at resistance
Technically, resistance is defined by the Ichimoku Kijun line at $0.04057500, while the closest support lies just below the current local price structure. The MACD on the daily chart continues to flash selling pressure; ADX signals any previous trend is losing strength. RSI sits at 40, CCI signals deep oversold territory, and Stoch RSI gives an overbought reading, producing a notable divergence — momentum remains negative, but short-term oscillators suggest the market is stretched. Bull/Bear Power (BBP) is still in seller territory, underlining ongoing downward pressure despite today's bounce, while intraday volatility remains moderate with price action near the session midpoint.
Downside bias holds as low breakout odds challenge GRT
Over the next five trading days, GRT is expected to move within a typical volatility band of $0.0330 – $0.0385. The probability of a price increase is very low (under 20%), with weekly trend and momentum indicators skewed to the downside. Most likely, GRT will churn sideways in this corridor as oversold conditions resolve and buyers remain hesitant. Should support near $0.0330 give way, a further downtrend is possible; however, a breakout above $0.0406 could trigger upside momentum, though this scenario is not favored without a shift in key indicators.
Last time, analysts noted that The Graph (GRT) continues to trade below key moving averages, with strong bearish momentum confirmed by negative readings across MACD, ADX, RSI, and other oscillators despite a recent intraday rally. Resistance remains at the Ichimoku Kijun level, while short-term support is near recent lows, indicating persistent selling pressure and elevated downside risk.


-
 Afghanistan
-
 Albania
-
 Algeria
-
 Angola
-
 Argentina
-
 Armenia
-
 Australia
-
 Austria
-
 Azerbaijan
-
 Bahamas
-
 Bahrain
-
 Bangladesh
-
 Belarus
-
 Belgium
-
 Bolivia
-
 Botswana
-
 Brazil
-
 Brunei
-
 Bulgaria
-
 Cambodia
-
 Cameroon
-
 Canada
-
 Chile
Chile
-
 China
China
-
 Colombia
-
 Congo
Congo
-
 Costa Rica
-
 Cote d'Ivoire
-
 Croatia
-
 Cuba
Cuba
-
 Cyprus
-
 Czechia
-
 DR Congo
-
 Denmark
-
 Dominican Republic
-
 Ecuador
-
 Egypt
Egypt
-
 El Salvador
-
 Estonia
-
 Eswatini
-
 Ethiopia
-
 Finland
-
 France
-
 Georgia
-
 Germany
-
 Ghana
Ghana
-
 Greece
-
 Haiti
Haiti
-
 Hong Kong
-
 Hungary
-
 India
India
-
 Indonesia
-
 Iran, Islamic republic
-
 Iraq
Iraq
-
 Ireland
-
 Israel
-
 Italy
Italy
-
 Jamaica
-
 Japan
Japan
-
 Jordan
-
 Kazakhstan
-
 Kenya
Kenya
-
 Korea
Korea
-
 Kuwait
-
 Kyrgyzstan
-
 Laos
Laos
-
 Latvia
-
 Lebanon
-
 Lesotho
-
 Libya
Libya
-
 Lithuania
-
 Luxembourg
-
 Madagascar
-
 Malaysia
-
 Malta
Malta
-
 Mauritius
-
 Mexico
-
 Moldova
-
 Mongolia
-
 Montenegro
-
 Morocco
-
 Mozambique
-
 Myanmar
-
 Namibia
-
 Nepal
Nepal
-
 Netherlands
-
 New Zealand
-
 Nigeria
-
 North Macedonia
-
 Norway
-
 Oman
Oman
-
 Pakistan
-
 Palestine
-
 Panama
-
 Papua New Guinea
-
 Paraguay
-
 Peru
Peru
-
 Philippines
-
 Poland
-
 Portugal
-
 Puerto Rico
-
 Qatar
Qatar
-
 Reunion
-
 Romania
-
 Rwanda
-
 Saudi Arabia
-
 Serbia
-
 Singapore
-
 Slovakia
-
 Slovenia
-
 Somalia
-
 South Africa
-
 Spain
Spain
-
 Sri Lanka
-
 Sweden
-
 Switzerland
-
 Syria
Syria
-
 Taiwan
-
 Tajikistan
-
 Tanzania
-
 Thailand
-
 Trinidad and Tobago
-
 Tunisia
-
 Turkey
-
 UAE
UAE
-
 Uganda
-
 Ukraine
-
 United Kingdom
-
United States
-
 Uruguay
-
 Uzbekistan
-
 Venezuela
-
 Vietnam
-
 Yemen
Yemen
-
 Zambia
-
 Zimbabwe
- Forex
- Crypto
