
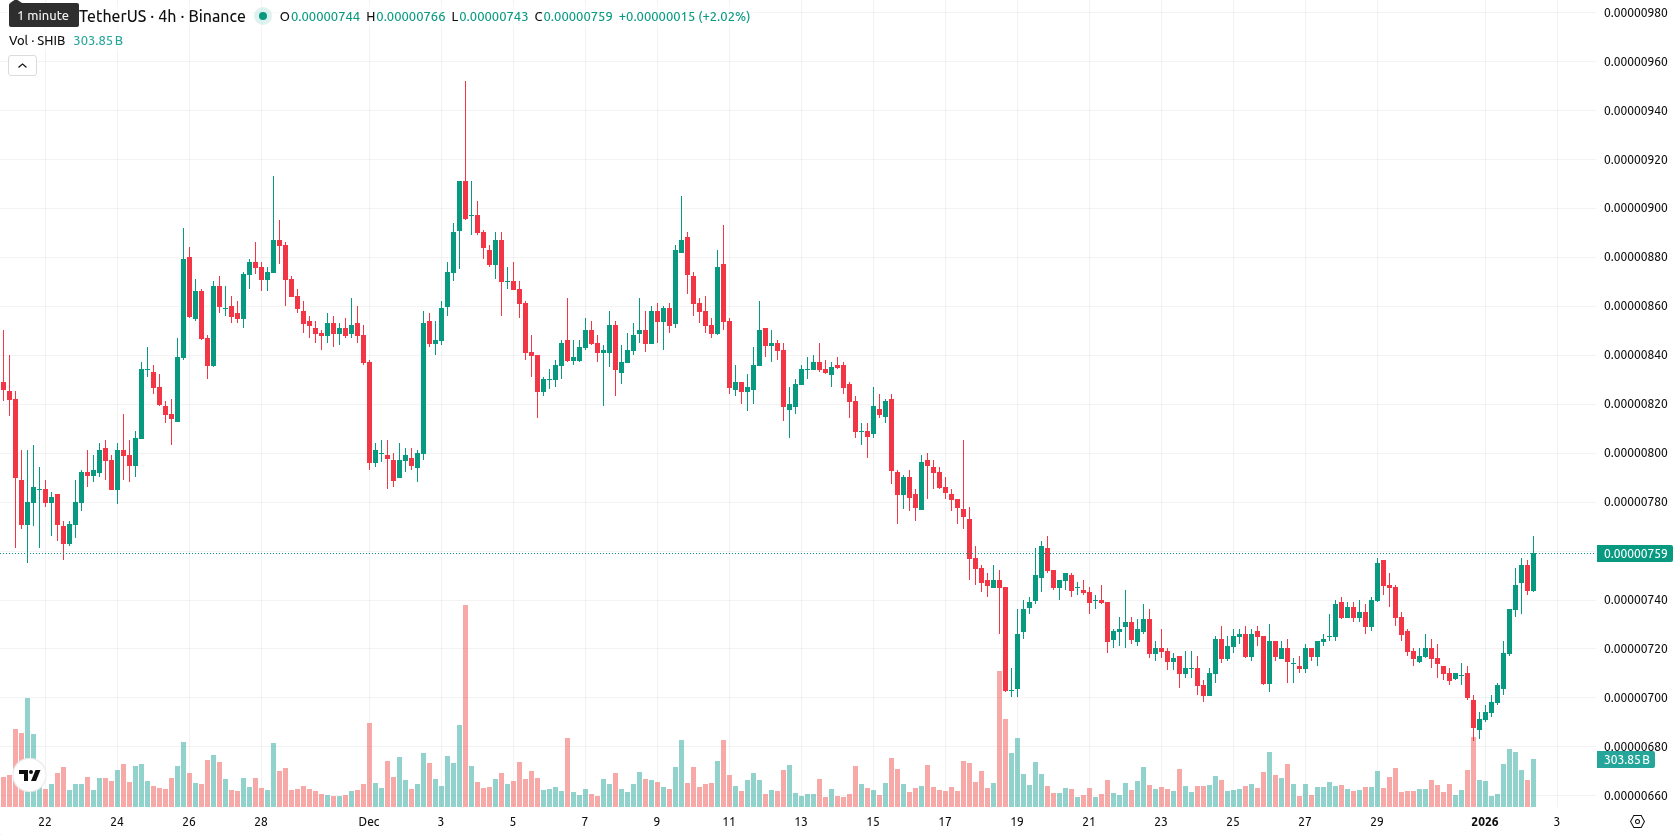
+8.02% for Shiba Inu — volatility and conflicting charts hint at possible correction

Shiba Inu (SHIB) is trading at $0.0000075, just above the MA-20 ($0.00000740) but below both the MA-50 ($0.00000807) and the MA-200 ($0.00001107), indicating some short-term positive momentum while medium- and long-term bearish pressure persists. The nearest resistance is found at the MA-50, with the Ichimoku Kijun level ($0.00000793) also acting as a ceiling in the near term.
Highlights
- SHIB trades at $0.0000075, showing short-term positive momentum above the MA-20 but remaining below both MA-50 ($0.00000807) and MA-200 ($0.00001107).
- Intraday surged 8.02% with high volatility toward session highs, but daily indicators (MACD, RSI, Stoch RSI) are mixed, signaling caution due to momentum divergences.
- Baseline scenario projects SHIB stabilizing between $0.0000073 and $0.0000077 this week, with less than 20% probability of a sustained price increase.
Volatility rises as momentum signals divergence and correction risk
Technically, daily momentum is mixed: the MACD on D1 remains in strong sell territory, the ADX sits at a weak 24.93 with ongoing seller dominance, and the RSI is mildly bearish at 46.8. Stoch RSI is fully overbought at 100, while the CCI is neutral, highlighting momentum discrepancies and a risk of correction. The Bull/Bear Power (BBP) signals strong buyer dominance intraday, with the price closing at the session high and no opening gap, confirming high volatility and strong buying interest into session highs. However, conflicting signals among momentum indicators and oscillators indicate an underlying divergence, so caution is warranted.
Bearish tilt persists as range-bound trading expected
For the coming week, SHIB is expected to remain within a typical volatility band between $0.0000073 and $0.0000077 relative to current levels. While momentum indicators currently suggest a low probability (less than 20%) of a sustained upward move, a decline appears more likely in the short term. A breakout above $0.0000077 would be required for a bullish scenario, whereas sustained closes below $0.0000073 would indicate a bearish breakdown. The baseline expectation is that SHIB will stabilize within this sideways price range.
Previously it was reported that Shiba Inu is trading below all key moving averages, with persistent bearish momentum confirmed by a strong sell MACD, elevated ADX, and oversold RSI and CCI levels, suggesting sustained weakness and limited buying interest. The asset remains constrained by resistance near the Ichimoku Kijun and faces a high probability of sideways movement within a tight range unless support breaks or clear upside momentum emerges above key resistance.


-
 Afghanistan
-
 Albania
-
 Algeria
-
 Angola
-
 Argentina
-
 Armenia
-
 Australia
-
 Austria
-
 Azerbaijan
-
 Bahamas
-
 Bahrain
-
 Bangladesh
-
 Belarus
-
 Belgium
-
 Bolivia
-
 Botswana
-
 Brazil
-
 Brunei
-
 Bulgaria
-
 Cambodia
-
 Cameroon
-
 Canada
-
 Chile
Chile
-
 China
China
-
 Colombia
-
 Congo
Congo
-
 Costa Rica
-
 Cote d'Ivoire
-
 Croatia
-
 Cuba
Cuba
-
 Cyprus
-
 Czechia
-
 DR Congo
-
 Denmark
-
 Dominican Republic
-
 Ecuador
-
 Egypt
Egypt
-
 El Salvador
-
 Estonia
-
 Eswatini
-
 Ethiopia
-
 Finland
-
 France
-
 Georgia
-
 Germany
-
 Ghana
Ghana
-
 Greece
-
 Haiti
Haiti
-
 Hong Kong
-
 Hungary
-
 India
India
-
 Indonesia
-
 Iran, Islamic republic
-
 Iraq
Iraq
-
 Ireland
-
 Israel
-
 Italy
Italy
-
 Jamaica
-
 Japan
Japan
-
 Jordan
-
 Kazakhstan
-
 Kenya
Kenya
-
 Korea
Korea
-
 Kuwait
-
 Kyrgyzstan
-
 Laos
Laos
-
 Latvia
-
 Lebanon
-
 Lesotho
-
 Libya
Libya
-
 Lithuania
-
 Luxembourg
-
 Madagascar
-
 Malaysia
-
 Malta
Malta
-
 Mauritius
-
 Mexico
-
 Moldova
-
 Mongolia
-
 Montenegro
-
 Morocco
-
 Mozambique
-
 Myanmar
-
 Namibia
-
 Nepal
Nepal
-
 Netherlands
-
 New Zealand
-
 Nigeria
-
 North Macedonia
-
 Norway
-
 Oman
Oman
-
 Pakistan
-
 Palestine
-
 Panama
-
 Papua New Guinea
-
 Paraguay
-
 Peru
Peru
-
 Philippines
-
 Poland
-
 Portugal
-
 Puerto Rico
-
 Qatar
Qatar
-
 Reunion
-
 Romania
-
 Rwanda
-
 Saudi Arabia
-
 Serbia
-
 Singapore
-
 Slovakia
-
 Slovenia
-
 Somalia
-
 South Africa
-
 Spain
Spain
-
 Sri Lanka
-
 Sweden
-
 Switzerland
-
 Syria
Syria
-
 Taiwan
-
 Tajikistan
-
 Tanzania
-
 Thailand
-
 Trinidad and Tobago
-
 Tunisia
-
 Turkey
-
 UAE
UAE
-
 Uganda
-
 Ukraine
-
 United Kingdom
-
United States
-
 Uruguay
-
 Uzbekistan
-
 Venezuela
-
 Vietnam
-
 Yemen
Yemen
-
 Zambia
-
 Zimbabwe
- Forex
- Crypto
