
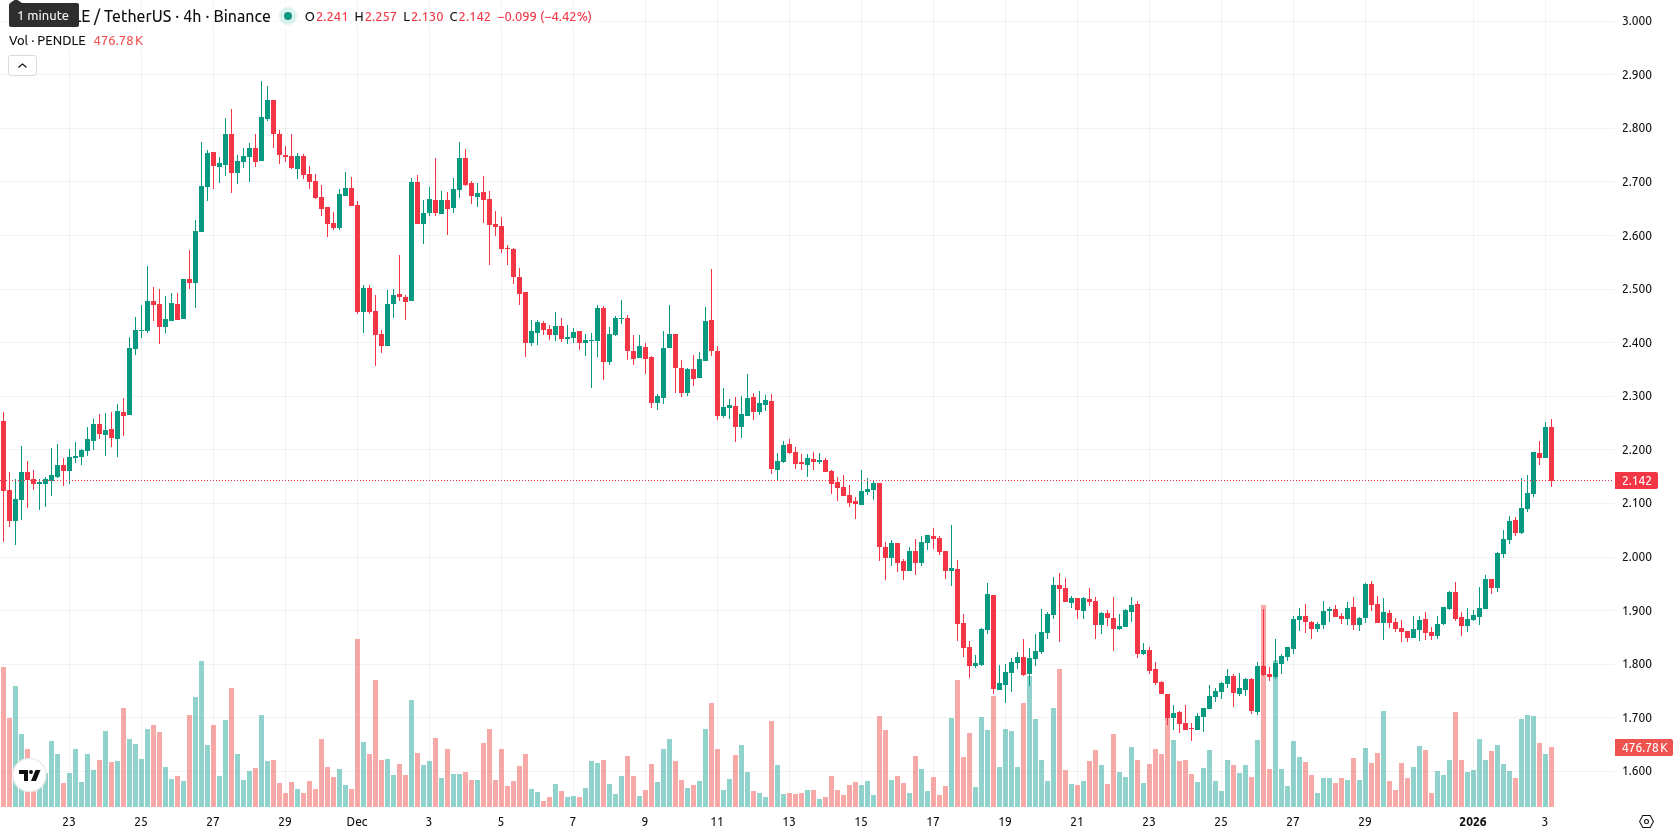
+8.19% for Pendle — buyers dominate despite overbought conditions

Pendle (PENDLE) is trading at $2.22, above its MA-20 ($1.8904) and just over its MA-50 ($2.2109), signaling strong short-term momentum but encountering medium-term resistance. The price holds above the Ichimoku Kijun level ($2.0960), positioning the next dynamic support at $2.10, with the MA-50 ($2.21) acting as immediate resistance and the distant MA-200 ($3.7016) maintaining long-term downward pressure.
Highlights
- PENDLE surged 8.19% to $2.22, trading above its MA-20 ($1.8904) and near its MA-50 ($2.2109), indicating strong short-term momentum amid resistance.
- Momentum indicators are mixed: RSI stands moderately bullish at 57.54, while MACD signals a strong sell and Stochastic RSI and CCI show overbought conditions.
- For the next five trading days, PENDLE is expected to consolidate between $2.12 and $2.36, with less than 20% probability of a further price increase.
Momentum split as buyers push volatility and signals diverge
Momentum signals are mixed: the MACD on D1 remains in strong sell territory while the ADX indicates ongoing but weakening downward trend strength. RSI is moderately bullish at 57.54, but both the Stochastic RSI and CCI show overbought conditions, pointing to possible short-term exhaustion. Bull/Bear Power is firmly positive, indicating buyer dominance intraday, while the Awesome Oscillator is neutral and does not reinforce the upwards move. Price action shows high volatility and a strong push towards the session’s top, but divergence among momentum and oscillator indicators suggest this advance may be stretched in the immediate term.
Limited upside expected as bearish momentum constrains range
Over the next five trading days, PENDLE is expected to trade within a $2.12 to $2.36 volatility band relative to current levels. The probability of further price increase is low — below 20% — as weekly momentum and moving averages point to a bearish trend. The baseline scenario is for consolidation between $2.12 and $2.36; a bullish reversal may see a break above $2.36, while renewed selling pressure below $2.12 could trigger further declines with $2.10 serving as the next key support.
Last time, analysts noted Pendle was trading above its short-term moving average while facing resistance at the MA-50, reflecting short-term bullish momentum amid persistent medium- and long-term selling pressure. Momentum indicators are mixed with bullish oscillators and overbought signals suggesting potential for consolidation or a near-term pullback, as the price remains volatile and trend signals diverge.


-
 Afghanistan
-
 Albania
-
 Algeria
-
 Angola
-
 Argentina
-
 Armenia
-
 Australia
-
 Austria
-
 Azerbaijan
-
 Bahamas
-
 Bahrain
-
 Bangladesh
-
 Belarus
-
 Belgium
-
 Bolivia
-
 Botswana
-
 Brazil
-
 Brunei
-
 Bulgaria
-
 Cambodia
-
 Cameroon
-
 Canada
-
 Chile
Chile
-
 China
China
-
 Colombia
-
 Congo
Congo
-
 Costa Rica
-
 Cote d'Ivoire
-
 Croatia
-
 Cuba
Cuba
-
 Cyprus
-
 Czechia
-
 DR Congo
-
 Denmark
-
 Dominican Republic
-
 Ecuador
-
 Egypt
Egypt
-
 El Salvador
-
 Estonia
-
 Eswatini
-
 Ethiopia
-
 Finland
-
 France
-
 Georgia
-
 Germany
-
 Ghana
Ghana
-
 Greece
-
 Haiti
Haiti
-
 Hong Kong
-
 Hungary
-
 India
India
-
 Indonesia
-
 Iran, Islamic republic
-
 Iraq
Iraq
-
 Ireland
-
 Israel
-
 Italy
Italy
-
 Jamaica
-
 Japan
Japan
-
 Jordan
-
 Kazakhstan
-
 Kenya
Kenya
-
 Korea
Korea
-
 Kuwait
-
 Kyrgyzstan
-
 Laos
Laos
-
 Latvia
-
 Lebanon
-
 Lesotho
-
 Libya
Libya
-
 Lithuania
-
 Luxembourg
-
 Madagascar
-
 Malaysia
-
 Malta
Malta
-
 Mauritius
-
 Mexico
-
 Moldova
-
 Mongolia
-
 Montenegro
-
 Morocco
-
 Mozambique
-
 Myanmar
-
 Namibia
-
 Nepal
Nepal
-
 Netherlands
-
 New Zealand
-
 Nigeria
-
 North Macedonia
-
 Norway
-
 Oman
Oman
-
 Pakistan
-
 Palestine
-
 Panama
-
 Papua New Guinea
-
 Paraguay
-
 Peru
Peru
-
 Philippines
-
 Poland
-
 Portugal
-
 Puerto Rico
-
 Qatar
Qatar
-
 Reunion
-
 Romania
-
 Rwanda
-
 Saudi Arabia
-
 Serbia
-
 Singapore
-
 Slovakia
-
 Slovenia
-
 Somalia
-
 South Africa
-
 Spain
Spain
-
 Sri Lanka
-
 Sweden
-
 Switzerland
-
 Syria
Syria
-
 Taiwan
-
 Tajikistan
-
 Tanzania
-
 Thailand
-
 Trinidad and Tobago
-
 Tunisia
-
 Turkey
-
 UAE
UAE
-
 Uganda
-
 Ukraine
-
 United Kingdom
-
United States
-
 Uruguay
-
 Uzbekistan
-
 Venezuela
-
 Vietnam
-
 Yemen
Yemen
-
 Zambia
-
 Zimbabwe
- Forex
- Crypto
