
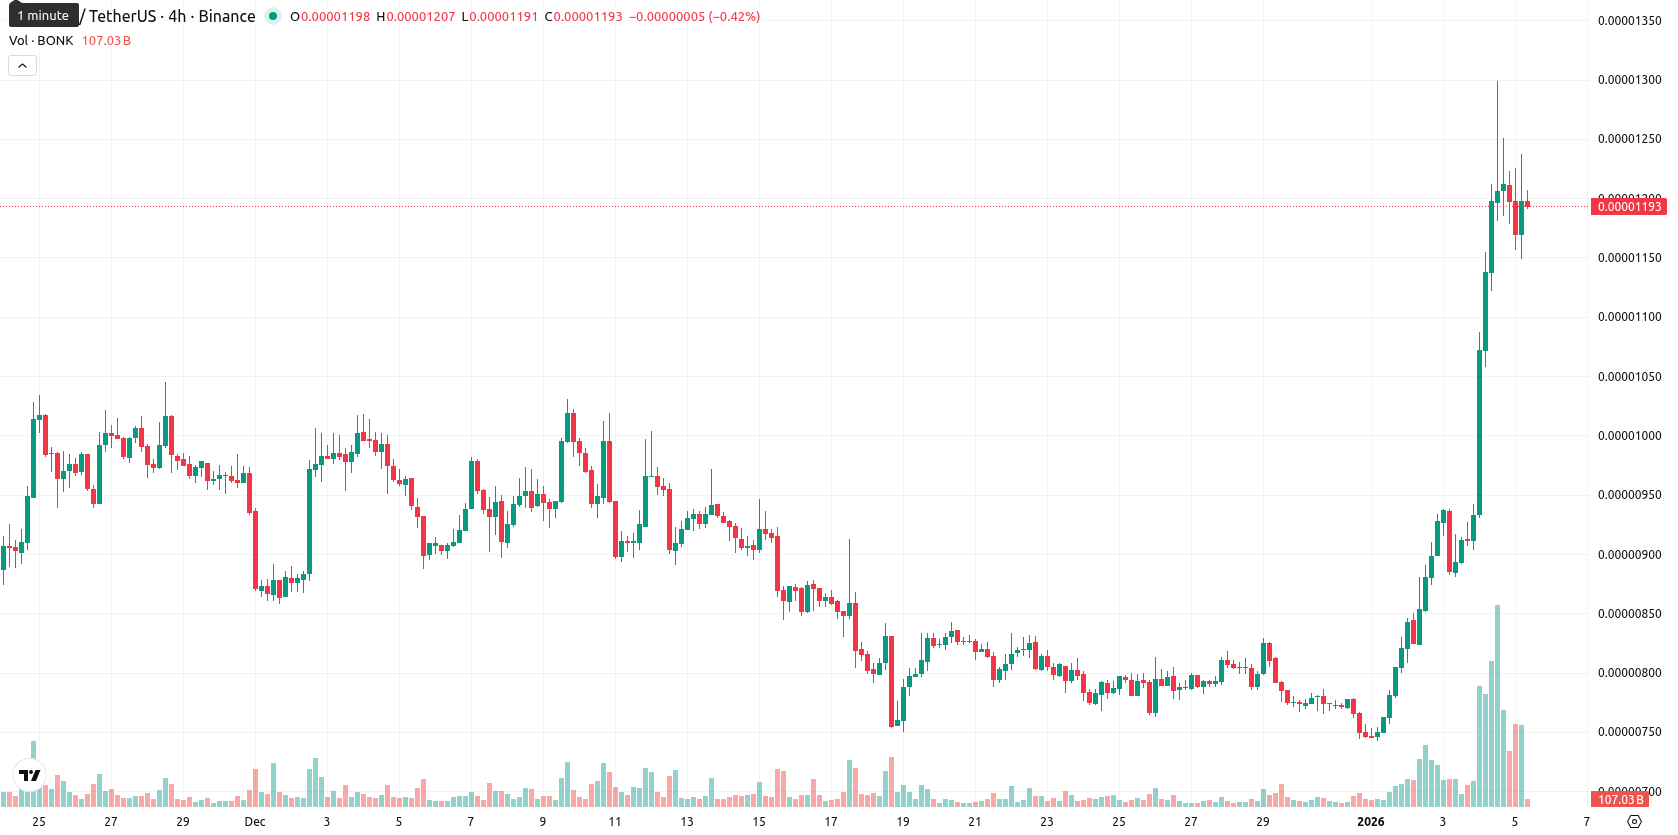
+7.59% for Bonk — bullish technicals fuel move above short-term averages

Bonk (BONK) is trading at $0.0000119, which is well above the MA-20 ($0.00000832) and MA-50 ($0.00000906), but below the long-term MA-200 ($0.00001780). This structure points to strong short- and medium-term bullish momentum, while the long-term trend remains under pressure from earlier sellers.
Highlights
- Bonk, a Solana-based meme coin, re-entered the top 100 crypto assets by market capitalization in January 2026 amid heightened trading activity.
- The token's surge was fueled by increased trading volumes and greater visibility within the Solana ecosystem, attracting both institutional and retail demand for Solana-linked assets.
- Sustained meme coin momentum and Bonk’s strong association with Solana continue to drive elevated engagement and liquidity in the token.
Renewed inflows as Solana demand lifts meme coin visibility
Bonk, a Solana-based meme coin, saw renewed interest as the token re-entered the top 100 crypto assets by market capitalization in January 2026. The token's rise was supported by increased trading volumes and broader visibility within the Solana ecosystem, aided by growing institutional and retail demand for Solana-related assets. Ongoing meme coin momentum and Bonk’s strong association with Solana continue to drive engagement and liquidity.
Bullish bias holds as technical signals flag overbought risk
For dynamic levels, the Ichimoku Kijun on D1 at $0.00001021 now acts as nearby support, while the $0.0000120 – 0.0000122 zone near recent highs and MA-50 serves as immediate resistance. Momentum signals are mixed but remain tilted bullish; ADX on D1 is strong at 33, confirming upward trend strength, while MACD is neutral. Both RSI (74) and CCI (405) are in overbought territory, and Stoch RSI is also maxed, signaling an extended rally. BBP is positive, highlighting dominant buyer pressure intraday, while the Awesome Oscillator points to a robust uptrend.
Downside favored as momentum weakens despite tight volatility band
For the next five trading days, the expected range is $0.00001204 to $0.00001222, representing a typical volatility band relative to current levels. The probability of further price increases is very low (under 20%) given neutral or bearish weekly momentum, making the likelihood of a decline significantly higher. The base case is sideways consolidation near present prices. A breakout above $0.00001222 would require additional momentum, while a move below support at $0.00001021 could lead to a corrective pullback if buyers lose interest.
Last time, analysts noted that Bonk was trading above its short- and medium-term moving averages, indicating bullish momentum, but remained below its long-term trend, reflecting ongoing resistance. Technical indicators highlight overbought conditions and mixed momentum signals, with consolidation between key support and resistance levels expected as upward breakout odds diminish.


Latest Bonk News


-
 Afghanistan
-
 Albania
-
 Algeria
-
 Angola
-
 Argentina
-
 Armenia
-
 Australia
-
 Austria
-
 Azerbaijan
-
 Bahamas
-
 Bahrain
-
 Bangladesh
-
 Belarus
-
 Belgium
-
 Bolivia
-
 Botswana
-
 Brazil
-
 Brunei
-
 Bulgaria
-
 Cambodia
-
 Cameroon
-
 Canada
-
 Chile
Chile
-
 China
China
-
 Colombia
-
 Congo
Congo
-
 Costa Rica
-
 Cote d'Ivoire
-
 Croatia
-
 Cuba
Cuba
-
 Cyprus
-
 Czechia
-
 DR Congo
-
 Denmark
-
 Dominican Republic
-
 Ecuador
-
 Egypt
Egypt
-
 El Salvador
-
 Estonia
-
 Eswatini
-
 Ethiopia
-
 Finland
-
 France
-
 Georgia
-
 Germany
-
 Ghana
Ghana
-
 Greece
-
 Haiti
Haiti
-
 Hong Kong
-
 Hungary
-
 India
India
-
 Indonesia
-
 Iran, Islamic republic
-
 Iraq
Iraq
-
 Ireland
-
 Israel
-
 Italy
Italy
-
 Jamaica
-
 Japan
Japan
-
 Jordan
-
 Kazakhstan
-
 Kenya
Kenya
-
 Korea
Korea
-
 Kuwait
-
 Kyrgyzstan
-
 Laos
Laos
-
 Latvia
-
 Lebanon
-
 Lesotho
-
 Libya
Libya
-
 Lithuania
-
 Luxembourg
-
 Madagascar
-
 Malaysia
-
 Malta
Malta
-
 Mauritius
-
 Mexico
-
 Moldova
-
 Mongolia
-
 Montenegro
-
 Morocco
-
 Mozambique
-
 Myanmar
-
 Namibia
-
 Nepal
Nepal
-
 Netherlands
-
 New Zealand
-
 Nigeria
-
 North Macedonia
-
 Norway
-
 Oman
Oman
-
 Pakistan
-
 Palestine
-
 Panama
-
 Papua New Guinea
-
 Paraguay
-
 Peru
Peru
-
 Philippines
-
 Poland
-
 Portugal
-
 Puerto Rico
-
 Qatar
Qatar
-
 Reunion
-
 Romania
-
 Rwanda
-
 Saudi Arabia
-
 Serbia
-
 Singapore
-
 Slovakia
-
 Slovenia
-
 Somalia
-
 South Africa
-
 Spain
Spain
-
 Sri Lanka
-
 Sweden
-
 Switzerland
-
 Syria
Syria
-
 Taiwan
-
 Tajikistan
-
 Tanzania
-
 Thailand
-
 Trinidad and Tobago
-
 Tunisia
-
 Turkey
-
 UAE
UAE
-
 Uganda
-
 Ukraine
-
 United Kingdom
-
United States
-
 Uruguay
-
 Uzbekistan
-
 Venezuela
-
 Vietnam
-
 Yemen
Yemen
-
 Zambia
-
 Zimbabwe
- Forex
- Crypto
