
The Graph: overbought conditions drive a 7.22% jump, but resistance limits upside

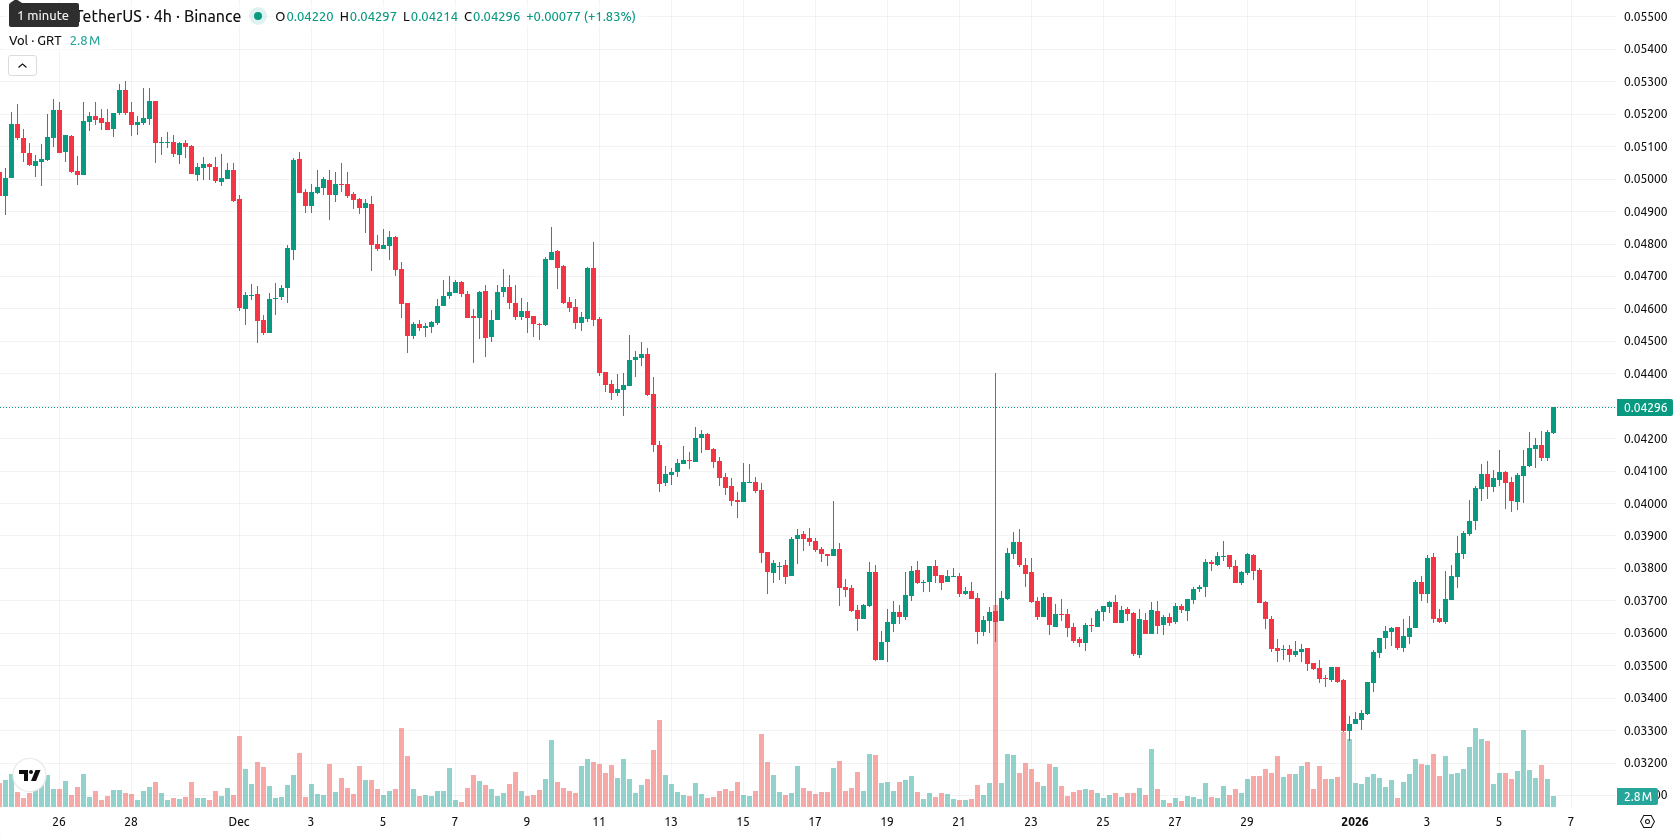
The Graph (GRT) is trading at $0.042911, just above the MA-20 ($0.037089) and slightly below the MA-50 ($0.043601), indicating near-term upward momentum but medium-term resistance overhead. The price remains well below the MA-200 ($0.074334), confirming persistent long-term selling pressure, while the closest dynamic support is the Ichimoku Kijun at $0.039185 and resistance is nearby at the MA-50.
Highlights
- GRT trades at $0.042911, above the MA-20 ($0.037089) but just below the MA-50 ($0.043601), signaling short-term momentum with medium-term resistance looming.
- Technical indicators are mixed as RSI is bullish and price rose 7.22% today, but CCI and Stoch RSI strongly warn of overbought conditions and potential for correction.
- Expected five-day range is $0.04100 to $0.04500, with less than 20% probability of further price increases, favoring sideways or pullback scenarios.
Overbought risks emerge as momentum signals conflict
Momentum indicators are mixed: the ADX on the daily timeframe favors buyers, yet the MACD signals ongoing downside pressure and near-term divergence. RSI sits in bullish territory, while both the CCI and Stoch RSI indicate strongly overbought conditions, suggesting the rally could be overextended. Bull/Bear Power (BBP) is marginally positive, reflecting slight intraday buyer dominance, while the Awesome Oscillator remains neutral. GRT is currently trading near the top of the day’s range in a period of moderate volatility, supporting continued strength toward session highs but with potential for cooling if overbought signals materialize.
Pullback risk rises as overbought levels limit upside
For the next five trading days, the price corridor is projected at $0.04100 to $0.04500, representing a volatility band relative to current levels. The likelihood of further price increases is very low (less than 20%), making a pullback or sideways movement more probable. The base scenario anticipates stabilization between support at $0.03918 and resistance at $0.04360. A sustained breakout above $0.04360 could push towards $0.04500, while a bearish break below $0.04100 would open the door to declines as deep as the $0.03920 region or below, warranting a cautious approach as overbought conditions may limit further upside.
Previously it was reported that The Graph (GRT) is exhibiting short-term bullish momentum, trading above its 20-day moving average but still below the 50- and 200-day moving averages, with immediate resistance near the MA-50 and support aligning with the Ichimoku Kijun line. Despite intraday strength and rising volatility, mixed momentum indicators (bearish MACD and ADX, divergent oscillators, and overbought signals) suggest upside potential may be constrained by possible exhaustion.


-
 Afghanistan
-
 Albania
-
 Algeria
-
 Angola
-
 Argentina
-
 Armenia
-
 Australia
-
 Austria
-
 Azerbaijan
-
 Bahamas
-
 Bahrain
-
 Bangladesh
-
 Belarus
-
 Belgium
-
 Bolivia
-
 Botswana
-
 Brazil
-
 Brunei
-
 Bulgaria
-
 Cambodia
-
 Cameroon
-
 Canada
-
 Chile
Chile
-
 China
China
-
 Colombia
-
 Congo
Congo
-
 Costa Rica
-
 Cote d'Ivoire
-
 Croatia
-
 Cuba
Cuba
-
 Cyprus
-
 Czechia
-
 DR Congo
-
 Denmark
-
 Dominican Republic
-
 Ecuador
-
 Egypt
Egypt
-
 El Salvador
-
 Estonia
-
 Eswatini
-
 Ethiopia
-
 Finland
-
 France
-
 Georgia
-
 Germany
-
 Ghana
Ghana
-
 Greece
-
 Haiti
Haiti
-
 Hong Kong
-
 Hungary
-
 India
India
-
 Indonesia
-
 Iran, Islamic republic
-
 Iraq
Iraq
-
 Ireland
-
 Israel
-
 Italy
Italy
-
 Jamaica
-
 Japan
Japan
-
 Jordan
-
 Kazakhstan
-
 Kenya
Kenya
-
 Korea
Korea
-
 Kuwait
-
 Kyrgyzstan
-
 Laos
Laos
-
 Latvia
-
 Lebanon
-
 Lesotho
-
 Libya
Libya
-
 Lithuania
-
 Luxembourg
-
 Madagascar
-
 Malaysia
-
 Malta
Malta
-
 Mauritius
-
 Mexico
-
 Moldova
-
 Mongolia
-
 Montenegro
-
 Morocco
-
 Mozambique
-
 Myanmar
-
 Namibia
-
 Nepal
Nepal
-
 Netherlands
-
 New Zealand
-
 Nigeria
-
 North Macedonia
-
 Norway
-
 Oman
Oman
-
 Pakistan
-
 Palestine
-
 Panama
-
 Papua New Guinea
-
 Paraguay
-
 Peru
Peru
-
 Philippines
-
 Poland
-
 Portugal
-
 Puerto Rico
-
 Qatar
Qatar
-
 Reunion
-
 Romania
-
 Rwanda
-
 Saudi Arabia
-
 Serbia
-
 Singapore
-
 Slovakia
-
 Slovenia
-
 Somalia
-
 South Africa
-
 Spain
Spain
-
 Sri Lanka
-
 Sweden
-
 Switzerland
-
 Syria
Syria
-
 Taiwan
-
 Tajikistan
-
 Tanzania
-
 Thailand
-
 Trinidad and Tobago
-
 Tunisia
-
 Turkey
-
 UAE
UAE
-
 Uganda
-
 Ukraine
-
 United Kingdom
-
United States
-
 Uruguay
-
 Uzbekistan
-
 Venezuela
-
 Vietnam
-
 Yemen
Yemen
-
 Zambia
-
 Zimbabwe
- Forex
- Crypto
