
Ethereum price prediction: Can ETF tailwinds and bullish signals lift ETH higher?

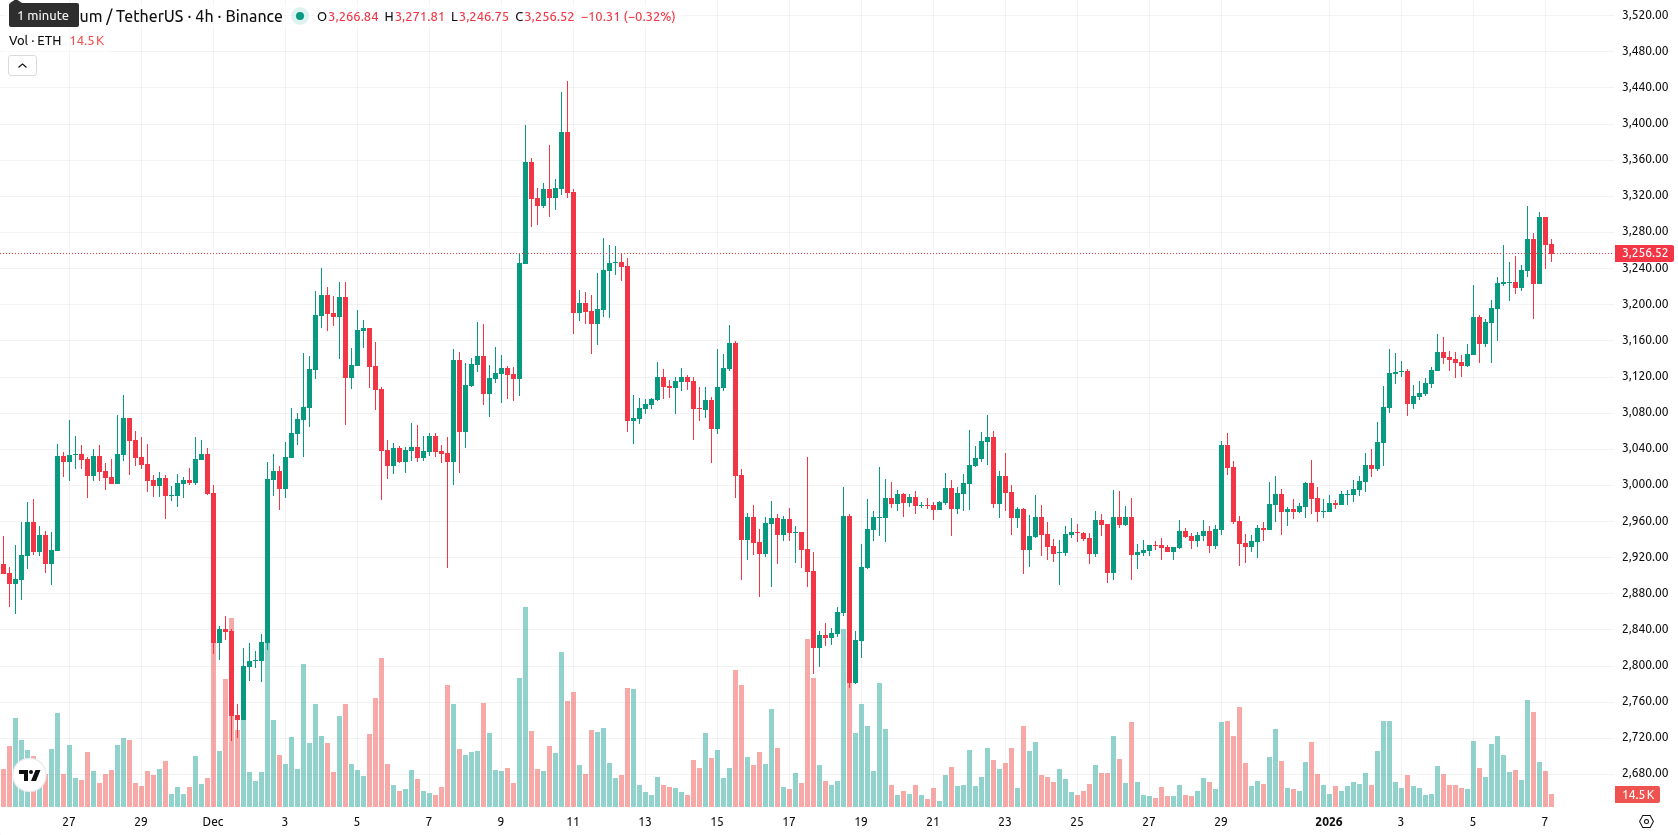
Ethereum (ETH) is trading at $3,248.63 after rising 0.93% ($29.91) on the day, currently holding well above both the MA-20 ($3,011.99) and MA-50 ($3,015.83), yet still capped beneath the MA-200 ($3,610.19). This setup confirms a short- and medium-term bullish structure, though the long-term trend reveals continued resistance, with the closest dynamic support near the Ichimoku Kijun at $3,040.60 and resistance clustering around the MA-50 and the $3,300–$3,350 range.
Highlights
- U.S. spot Ethereum ETFs, including Grayscale's ETHE and BlackRock's ETHA, recorded a combined $168 million net inflow amid increased institutional and retail participation.
- The validator exit queue collapsed by 99.9% as over 1.3 million ETH returned to staking, reducing sell pressure and signaling greater long-term confidence.
- SEC regulatory clarity that Ethereum is not a security has simplified institutional involvement and the distribution of staking rewards.
Staking inflows and SEC clarity drive institutional participation
Ethereum has been boosted by a surge in U.S. spot ETF inflows, as products like Grayscale's ETHE and BlackRock's ETHA recorded a combined $168 million net inflow, with the introduction of direct staking reward payouts marking greater accessibility for both institutional and retail participants. The validator exit queue collapsed by 99.9%, reflecting decreased sell pressure and strengthened long-term confidence, as more than 1.3 million ETH returned to staking. Regulatory clarity from the SEC, confirming that Ethereum is not a security, has further simplified institutional involvement and staking reward distribution.
Overbought signals temper momentum as consolidation persists
Momentum indicators on the daily chart remain positive: the MACD is issuing a buy signal, while the ADX measures an uptrend in progress that has not yet reached high conviction. Several oscillators, including the Stochastic RSI and CCI, are in overbought territory, and Bull/Bear Power suggests strong buyer dominance. The Awesome Oscillator confirms ongoing upward momentum. Technically, Ethereum is consolidating mid-range ($3,239.66–$3,295.58) after early-session strength, which, combined with bullish momentum and overbought oscillators, raises caution for a potential near-term pullback despite the prevailing uptrend. Key dynamic support stands at the Ichimoku Kijun ($3,040.60), with resistance seen at the MA-50 and round numbers in the $3,300–$3,350 zone.
Gains capped by resistance as volatility bands define range
For the coming week, the typical volatility band is projected between $3,140 and $3,370, based on the current price of $3,248.63 and recent trading behavior. Momentum signals, including the supportive MA-50 and broader daily trend, suggest a moderate probability (about 50%) for further gains, with stabilization expected within this price range. A breakout above resistance may target $3,400 or higher if buying strength holds, while a short-term exhaustion and pullback could see support tested at $3,040 or even a retest of the $3,000–$3,050 area.
Last time, analysts noted that Ethereum remains above key short- and medium-term moving averages, retaining bullish momentum, but faces ongoing long-term resistance below its 200-day MA amid overbought technical signals such as elevated RSI and CCI. Immediate support and resistance are closely aligned, with momentum indicators turning mixed and suggesting a likely near-term consolidation within a defined volatility band as buying pressure shows signs of overextension.


-
 Afghanistan
-
 Albania
-
 Algeria
-
 Angola
-
 Argentina
-
 Armenia
-
 Australia
-
 Austria
-
 Azerbaijan
-
 Bahamas
-
 Bahrain
-
 Bangladesh
-
 Belarus
-
 Belgium
-
 Bolivia
-
 Botswana
-
 Brazil
-
 Brunei
-
 Bulgaria
-
 Cambodia
-
 Cameroon
-
 Canada
-
 Chile
Chile
-
 China
China
-
 Colombia
-
 Congo
Congo
-
 Costa Rica
-
 Cote d'Ivoire
-
 Croatia
-
 Cuba
Cuba
-
 Cyprus
-
 Czechia
-
 DR Congo
-
 Denmark
-
 Dominican Republic
-
 Ecuador
-
 Egypt
Egypt
-
 El Salvador
-
 Estonia
-
 Eswatini
-
 Ethiopia
-
 Finland
-
 France
-
 Georgia
-
 Germany
-
 Ghana
Ghana
-
 Greece
-
 Haiti
Haiti
-
 Hong Kong
-
 Hungary
-
 India
India
-
 Indonesia
-
 Iran, Islamic republic
-
 Iraq
Iraq
-
 Ireland
-
 Israel
-
 Italy
Italy
-
 Jamaica
-
 Japan
Japan
-
 Jordan
-
 Kazakhstan
-
 Kenya
Kenya
-
 Korea
Korea
-
 Kuwait
-
 Kyrgyzstan
-
 Laos
Laos
-
 Latvia
-
 Lebanon
-
 Lesotho
-
 Libya
Libya
-
 Lithuania
-
 Luxembourg
-
 Madagascar
-
 Malaysia
-
 Malta
Malta
-
 Mauritius
-
 Mexico
-
 Moldova
-
 Mongolia
-
 Montenegro
-
 Morocco
-
 Mozambique
-
 Myanmar
-
 Namibia
-
 Nepal
Nepal
-
 Netherlands
-
 New Zealand
-
 Nigeria
-
 North Macedonia
-
 Norway
-
 Oman
Oman
-
 Pakistan
-
 Palestine
-
 Panama
-
 Papua New Guinea
-
 Paraguay
-
 Peru
Peru
-
 Philippines
-
 Poland
-
 Portugal
-
 Puerto Rico
-
 Qatar
Qatar
-
 Reunion
-
 Romania
-
 Rwanda
-
 Saudi Arabia
-
 Serbia
-
 Singapore
-
 Slovakia
-
 Slovenia
-
 Somalia
-
 South Africa
-
 Spain
Spain
-
 Sri Lanka
-
 Sweden
-
 Switzerland
-
 Syria
Syria
-
 Taiwan
-
 Tajikistan
-
 Tanzania
-
 Thailand
-
 Trinidad and Tobago
-
 Tunisia
-
 Turkey
-
 UAE
UAE
-
 Uganda
-
 Ukraine
-
 United Kingdom
-
United States
-
 Uruguay
-
 Uzbekistan
-
 Venezuela
-
 Vietnam
-
 Yemen
Yemen
-
 Zambia
-
 Zimbabwe
- Forex
- Crypto
