
Polygon: technical upgrades and staking lockups support short-term gains

Polygon (POL, formerly MATIC) is trading at $0.1264, sitting above both the MA-20 ($0.1095) and MA-50 ($0.1206) but still well below the MA-200 ($0.1948), reflecting a constructive short-term and medium-term trend within a longer-term bearish structure.
POL price prediction
Current price:
$ 0.0719
0.0005
0.73%
Real-time Data
03:20
Daily range
0.0708
 0.0723
Weekly range
0.0683
0.0824
Loading...
Highlights
- Polygon's POL token has entered a deflationary phase, with up to 3.5% of total supply potentially burned in 2026 driven by a daily 1 million token burn rate.
- Currently, 3.6 billion POL tokens are locked in staking, and the community is considering redirecting at least 20% of quarterly network revenues to buybacks or further burns from a 2% inflation model.
- Polygon is rolling out technical upgrades like AggLayer and Gigagas for greater scalability and interoperability, while partnerships with Revolut and Mastercard are boosting transaction volume and adoption.
Supply contraction and network upgrades fuel renewed inflows and adoption
Polygon has entered a deflationary phase, with reports indicating up to 3.5% of POL’s total supply could be burned in 2026 due to a daily burn rate of approximately 1 million tokens. In addition, about 3.6 billion POL tokens are currently locked in staking, while the community is considering shifting from a 2% inflation rate to a model that uses at least 20% of quarterly network revenues for buybacks or further token burns. Technical upgrades like AggLayer and Gigagas are being implemented to enhance interoperability and scalability, and recent partnerships with Revolut and Mastercard are driving increased transaction volume and adoption.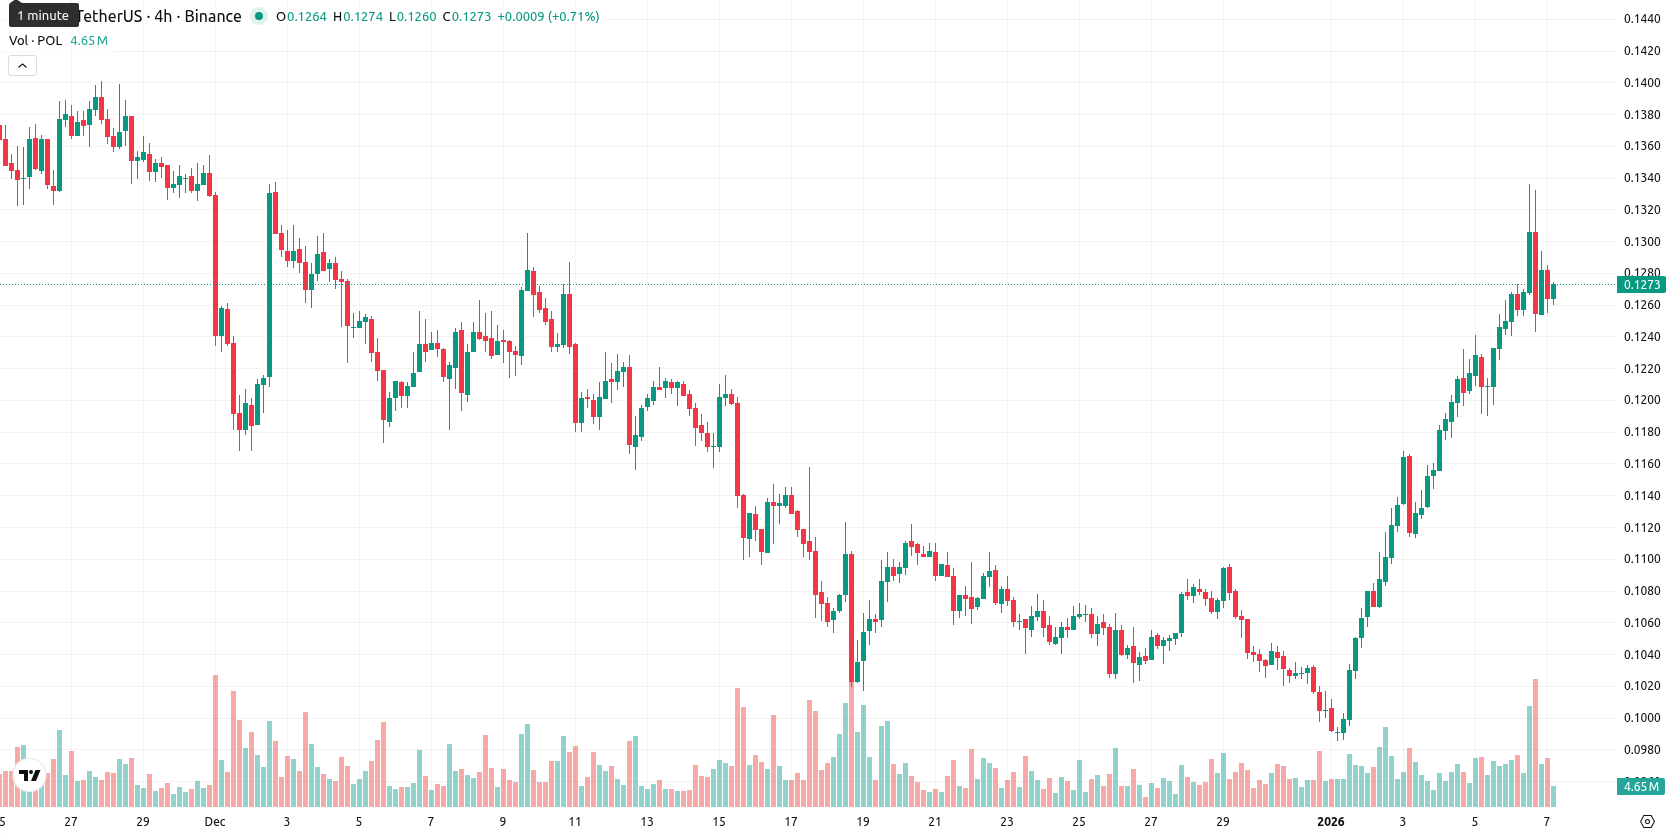
Uptrend confirmed as mixed momentum meets overbought technicals
The nearest dynamic support stands at the Ichimoku Kijun level of $0.1161, while MA-50 near $0.1206 now acts as the closest support, with resistance forming at the round $0.1300 area. Momentum gauges on the daily chart are mixed: the MACD is neutral but ADX shows strong upward momentum. The RSI is in bullish territory but trending toward overbought, and this is reinforced by Stochastic RSI and CCI both showing overbought conditions. Bull/Bear Power remains positive, and the Awesome Oscillator confirms the current uptrend, even as intraday tone turns more sideways after an initial surge.Downside risk persists as breakout odds remain limited
Over the next five trading days, the expected price band for POL is $0.1230–$0.1295, marking the typical volatility band relative to current levels. The likelihood of a sustained upward breakout remains low at less than 20%, so a decline this week is more probable. Baseline scenario: POL consolidates between $0.1230 and $0.1295. A decisive move above $0.1300 may trigger a squeeze higher, while a break below $0.1230 could prompt a retest of the Ichimoku Kijun support and further downside.
Viktoras Karapetjanc, Traders Union analyst, sees Polygon’s deflationary turn and new strategic partnerships as key drivers of long-term value. He believes current on-chain momentum and strong adoption trends balance out the short-term technical caution. This expert maintains a constructive bias with the view that fundamental tailwinds could reinforce price stability, even if macro risk tempers the odds of a near-term breakout. "I remain optimistic on Polygon’s medium-term potential, especially as tokenomics shift and adoption accelerates."
Last time, analysts noted that Polygon (POL) is trading above its short- and medium-term moving averages, indicating ongoing bullish momentum, but the asset remains capped below key long-term resistance levels and faces mixed signals from momentum indicators such as an overbought RSI and selling pressure on the MACD. The near-term outlook calls for continued consolidation within a tight range, with upside limited by technical resistance and an elevated risk of short-term downside if support levels fail.
Source of Data:
POL Price Analysis by TU
The analysis is based on a proprietary model combining technical, on-chain, and expert data. Not investment advice. See
methodology
The information is based on forecasts and does not constitute investment advice or a guarantee of future results. Market conditions may change. See our Disclaimer and Editorial Integrity for details.
Subscribe to TU news

Did you like the article?


Latest Polygon News

Weekly Top Bonuses

Top News


Top 5 companies for you

United States
-
 Afghanistan
-
 Albania
-
 Algeria
-
 Angola
-
 Argentina
-
 Armenia
-
 Australia
-
 Austria
-
 Azerbaijan
-
 Bahamas
-
 Bahrain
-
 Bangladesh
-
 Belarus
-
 Belgium
-
 Bolivia
-
 Botswana
-
 Brazil
-
 Brunei
-
 Bulgaria
-
 Cambodia
-
 Cameroon
-
 Canada
-
 Chile
Chile
-
 China
China
-
 Colombia
-
 Congo
Congo
-
 Costa Rica
-
 Cote d'Ivoire
-
 Croatia
-
 Cuba
Cuba
-
 Cyprus
-
 Czechia
-
 DR Congo
-
 Denmark
-
 Dominican Republic
-
 Ecuador
-
 Egypt
Egypt
-
 El Salvador
-
 Estonia
-
 Eswatini
-
 Ethiopia
-
 Finland
-
 France
-
 Georgia
-
 Germany
-
 Ghana
Ghana
-
 Greece
-
 Haiti
Haiti
-
 Hong Kong
-
 Hungary
-
 India
India
-
 Indonesia
-
 Iran, Islamic republic
-
 Iraq
Iraq
-
 Ireland
-
 Israel
-
 Italy
Italy
-
 Jamaica
-
 Japan
Japan
-
 Jordan
-
 Kazakhstan
-
 Kenya
Kenya
-
 Korea
Korea
-
 Kuwait
-
 Kyrgyzstan
-
 Laos
Laos
-
 Latvia
-
 Lebanon
-
 Lesotho
-
 Libya
Libya
-
 Lithuania
-
 Luxembourg
-
 Madagascar
-
 Malaysia
-
 Malta
Malta
-
 Mauritius
-
 Mexico
-
 Moldova
-
 Mongolia
-
 Montenegro
-
 Morocco
-
 Mozambique
-
 Myanmar
-
 Namibia
-
 Nepal
Nepal
-
 Netherlands
-
 New Zealand
-
 Nigeria
-
 North Macedonia
-
 Norway
-
 Oman
Oman
-
 Pakistan
-
 Palestine
-
 Panama
-
 Papua New Guinea
-
 Paraguay
-
 Peru
Peru
-
 Philippines
-
 Poland
-
 Portugal
-
 Puerto Rico
-
 Qatar
Qatar
-
 Reunion
-
 Romania
-
 Rwanda
-
 Saudi Arabia
-
 Serbia
-
 Singapore
-
 Slovakia
-
 Slovenia
-
 Somalia
-
 South Africa
-
 Spain
Spain
-
 Sri Lanka
-
 Sweden
-
 Switzerland
-
 Syria
Syria
-
 Taiwan
-
 Tajikistan
-
 Tanzania
-
 Thailand
-
 Trinidad and Tobago
-
 Tunisia
-
 Turkey
-
 UAE
UAE
-
 Uganda
-
 Ukraine
-
 United Kingdom
-
United States
-
 Uruguay
-
 Uzbekistan
-
 Venezuela
-
 Vietnam
-
 Yemen
Yemen
-
 Zambia
-
 Zimbabwe
- Forex
- Crypto
Live News
