
Hedera: Sideways range looms as bearish momentum triggers a 7.41% decline

Hedera (HBAR) is trading at $0.1239, sitting above the MA-20 ($0.1151) but below the MA-50 ($0.1273) and well under the MA-200 ($0.1900), reflecting short-term resilience but ongoing medium- and long-term bearish pressure.
 0.0673
0.0684
0.0673
0.0684
Highlights
- Hedera's trading volume surged 38% to $166 million amid growing institutional support and accelerating enterprise usage.
- New energy sector agreements will utilize hashgraph technology for secure transactions and audits, expanding real-world adoption of Hedera.
- CME Group and CF Benchmarks launched new reference rates for HBAR, enhancing institutional transparency as Google and IBM remain active in the Hedera Governing Council.
Institutional backing grows as enterprise adoption accelerates
Hedera is seeing strong institutional support as enterprise usage accelerates, with trading volume growing 38% to $166 million. Recent deals in the energy sector will leverage hashgraph technology for secure transactions and audits, while major organizations like Google and IBM continue their participation in the Hedera Governing Council to help drive enterprise-grade compliance. CME Group and CF Benchmarks have launched new reference rates for HBAR, further increasing transparency for institutional players, while the network’s high transaction processing persists with real-world adoption expanding.
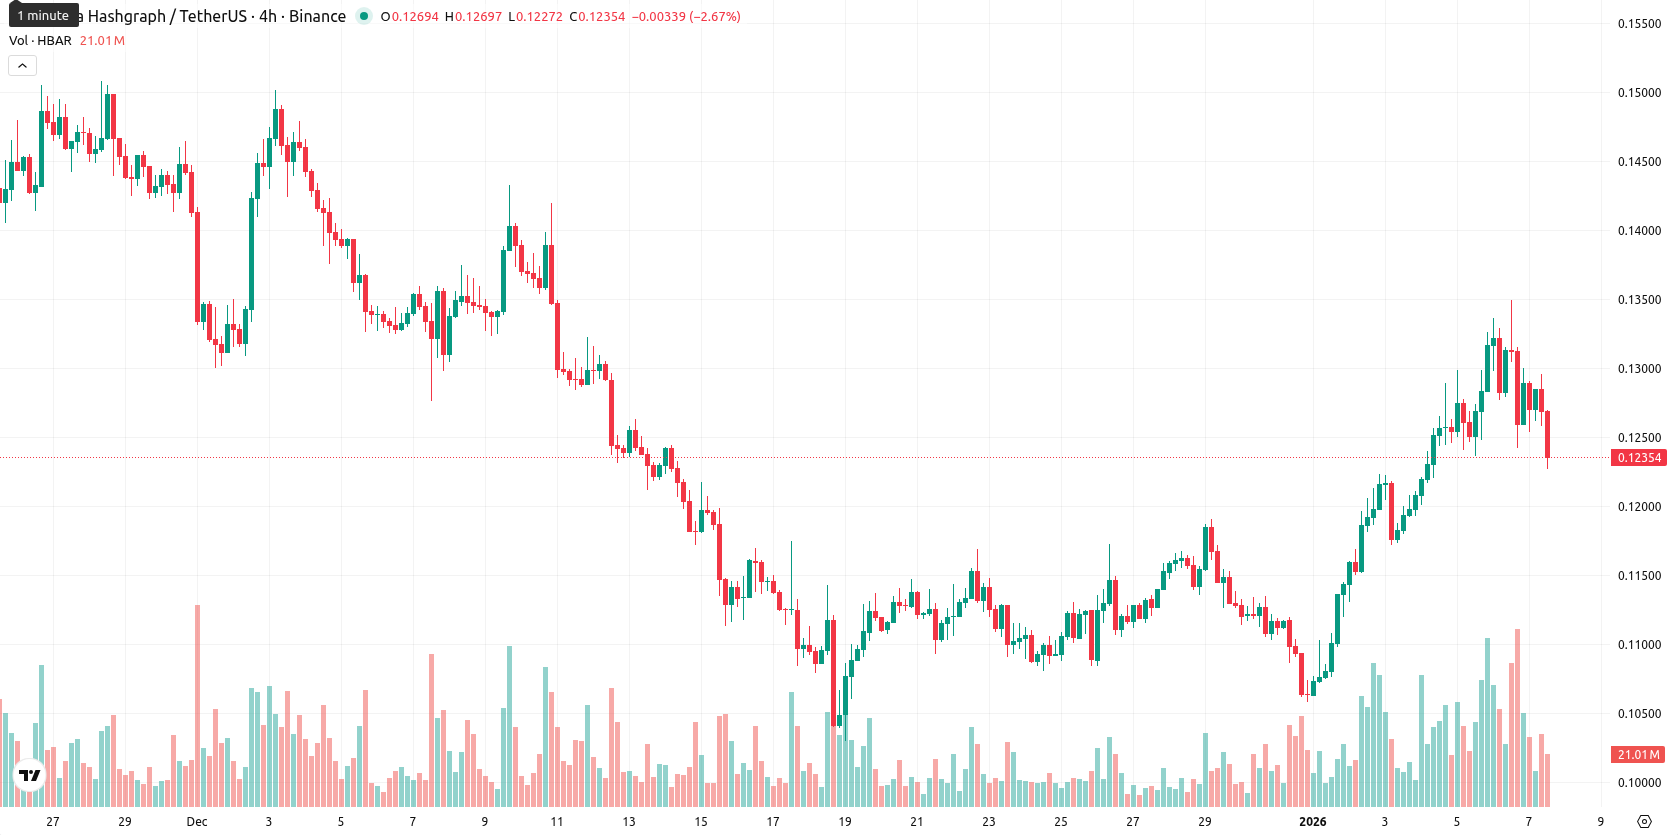
Divergent momentum as support holds and volatility persists
The nearest dynamic support for HBAR is at the Ichimoku Kijun ($0.1189), with resistance located near the MA-50 at $0.1273. Momentum signals are mixed: the MACD is neutral while the ADX signals a modest uptrend. RSI on the daily is in the buy zone, but Stochastic RSI and CCI are both deeply overbought, suggesting caution. Bull/Bear Power is marginally positive, indicating weak buyer dominance, but volatility is high as HBAR has dropped 7.41% today with no opening gap. The price is currently trading near the low end of today’s range, showing persistent pressure after the open. Divergence among oscillators highlights uncertainty, and intraday losses line up with waning momentum indicators.
Sideways trading expected as breakout risks diminish
For the next 5 trading days, HBAR’s typical volatility is expected to fall within the $0.1170 to $0.1295 band. The probability of further price increases is very low at less than 20%, with sideways movement in this range as the baseline scenario. A bullish case would need a break above $0.1273 toward $0.1300 if buyers regain interest, while a bearish case could see a drop below $0.1189 with potential testing of support near $0.1170.
Previously it was reported that Hedera is trading above its short- and medium-term moving averages and key support levels, indicating bullish short-term momentum, though it remains well below long-term resistance. Despite mixed technicals, including a neutral Awesome Oscillator and overbought readings on the RSI and Stoch RSI, near-term price action is likely to see sideways consolidation with downside risk as buyers face exhaustion around resistance.








-
 Afghanistan
-
 Albania
-
 Algeria
-
 Angola
-
 Argentina
-
 Armenia
-
 Australia
-
 Austria
-
 Azerbaijan
-
 Bahamas
-
 Bahrain
-
 Bangladesh
-
 Belarus
-
 Belgium
-
 Bolivia
-
 Botswana
-
 Brazil
-
 Brunei
-
 Bulgaria
-
 Cambodia
-
 Cameroon
-
 Canada
-
 Chile
Chile
-
 China
China
-
 Colombia
-
 Congo
Congo
-
 Costa Rica
-
 Cote d'Ivoire
-
 Croatia
-
 Cuba
Cuba
-
 Cyprus
-
 Czechia
-
 DR Congo
-
 Denmark
-
 Dominican Republic
-
 Ecuador
-
 Egypt
Egypt
-
 El Salvador
-
 Estonia
-
 Eswatini
-
 Ethiopia
-
 Finland
-
 France
-
 Georgia
-
 Germany
-
 Ghana
Ghana
-
 Greece
-
 Haiti
Haiti
-
 Hong Kong
-
 Hungary
-
 India
India
-
 Indonesia
-
 Iran, Islamic republic
-
 Iraq
Iraq
-
 Ireland
-
 Israel
-
 Italy
Italy
-
 Jamaica
-
 Japan
Japan
-
 Jordan
-
 Kazakhstan
-
 Kenya
Kenya
-
 Korea
Korea
-
 Kuwait
-
 Kyrgyzstan
-
 Laos
Laos
-
 Latvia
-
 Lebanon
-
 Lesotho
-
 Libya
Libya
-
 Lithuania
-
 Luxembourg
-
 Madagascar
-
 Malaysia
-
 Malta
Malta
-
 Mauritius
-
 Mexico
-
 Moldova
-
 Mongolia
-
 Montenegro
-
 Morocco
-
 Mozambique
-
 Myanmar
-
 Namibia
-
 Nepal
Nepal
-
 Netherlands
-
 New Zealand
-
 Nigeria
-
 North Macedonia
-
 Norway
-
 Oman
Oman
-
 Pakistan
-
 Palestine
-
 Panama
-
 Papua New Guinea
-
 Paraguay
-
 Peru
Peru
-
 Philippines
-
 Poland
-
 Portugal
-
 Puerto Rico
-
 Qatar
Qatar
-
 Reunion
-
 Romania
-
 Rwanda
-
 Saudi Arabia
-
 Serbia
-
 Singapore
-
 Slovakia
-
 Slovenia
-
 Somalia
-
 South Africa
-
 Spain
Spain
-
 Sri Lanka
-
 Sweden
-
 Switzerland
-
 Syria
Syria
-
 Taiwan
-
 Tajikistan
-
 Tanzania
-
 Thailand
-
 Trinidad and Tobago
-
 Tunisia
-
 Turkey
-
 UAE
UAE
-
 Uganda
-
 Ukraine
-
 United Kingdom
-
United States
-
 Uruguay
-
 Uzbekistan
-
 Venezuela
-
 Vietnam
-
 Yemen
Yemen
-
 Zambia
-
 Zimbabwe
- Forex
- Crypto











