
Avalanche price prediction: sideways trading expected as AVAX holds above $13 support

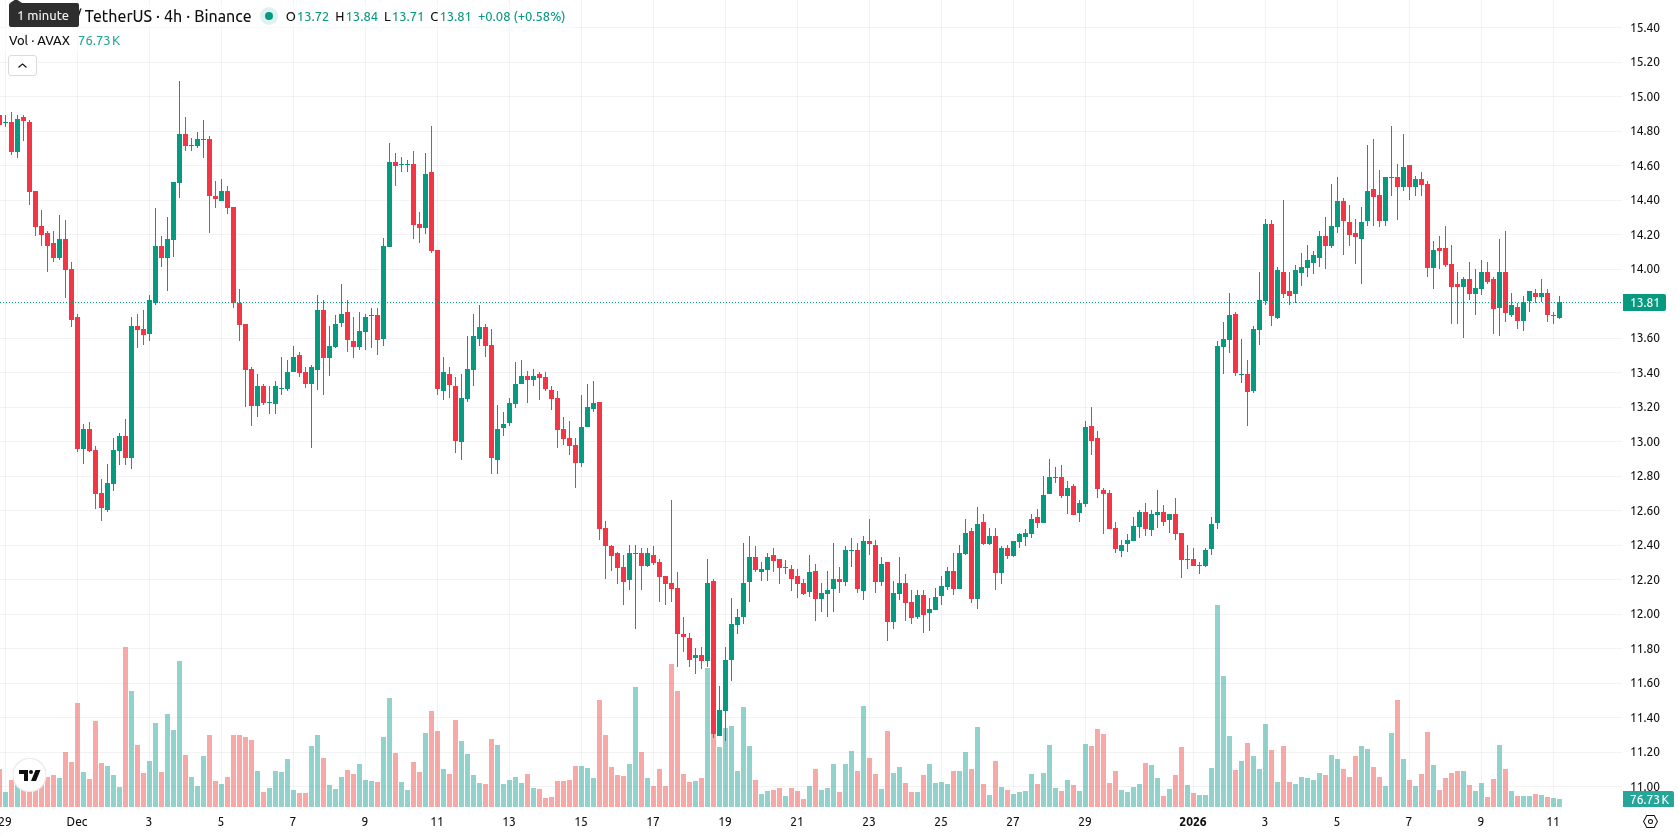
Avalanche (AVAX) is currently trading at $13.82, holding above both its 20-day ($13.20) and 50-day ($13.33) Moving Averages, but remaining well below the 200-day Moving Average at $20.59. This setup signals short- and medium-term support remains intact while underscoring persistent long-term resistance, with the Ichimoku Kijun at $13.05 acting as the nearest dynamic support and the 50-day Moving Average serving as immediate resistance.
 6.65
6.77
6.65
6.77
Highlights
- AVAX trades at $13.82, above its 20-day ($13.20) and 50-day ($13.33) Moving Averages, but well below the 200-day Moving Average at $20.59.
- Momentum indicators are mixed, as the MACD and ADX signal mild bullish momentum, RSI sits at 53.5, while oscillators remain neutral.
- The expected AVAX trading range for the coming week is $13.57 to $14.01, with less than 20% probability of a price increase and a bias toward sideways or lower movement.
Mixed momentum signals as buyers show mild intraday strength
Momentum signals are mixed on the daily chart. The MACD and ADX indicate mild bullish momentum, while the RSI points to modest buying strength at 53.5 and the Stochastic RSI and CCI sit neutral, showing neither overbought nor oversold conditions. Bull/Bear Power confirms buyers are favored intraday with a strong positive reading, while the Awesome Oscillator is neutral. The daily move has been mildly positive, with no gap between the previous close and today's open. The price is trading near today's high of $13.83, within a tight range and displaying low volatility. Intraday tone remains constructive, showing strength toward highs, yet some divergence among oscillators and momentum signals warrants caution.
Limited upside as sideways bias prevails near key supports
For the coming week, a typical volatility band is expected between $13.57 and $14.01. The probability of a price increase in this period is very low (less than 20%), making a further decline or lack of upside more likely. The baseline scenario suggests AVAX continues to trade sideways within this narrow band. A bullish scenario would require a break above the 50-day Moving Average resistance, while a slide below the Ichimoku Kijun and support at $13.05 would confirm a deeper retracement, in line with persistent long-term bearish signals.
Previously it was reported that Avalanche is trading above its short- and medium-term moving averages but remains under long-term pressure, with mixed daily momentum indicators suggesting only mild bullishness amid contracting volatility and a narrow trading range. Key support levels remain near $13.05 and resistance at $14.00, with downside risk prevailing unless new buying interest emerges.








-
 Afghanistan
-
 Albania
-
 Algeria
-
 Angola
-
 Argentina
-
 Armenia
-
 Australia
-
 Austria
-
 Azerbaijan
-
 Bahamas
-
 Bahrain
-
 Bangladesh
-
 Belarus
-
 Belgium
-
 Bolivia
-
 Botswana
-
 Brazil
-
 Brunei
-
 Bulgaria
-
 Cambodia
-
 Cameroon
-
 Canada
-
 Chile
Chile
-
 China
China
-
 Colombia
-
 Congo
Congo
-
 Costa Rica
-
 Cote d'Ivoire
-
 Croatia
-
 Cuba
Cuba
-
 Cyprus
-
 Czechia
-
 DR Congo
-
 Denmark
-
 Dominican Republic
-
 Ecuador
-
 Egypt
Egypt
-
 El Salvador
-
 Estonia
-
 Eswatini
-
 Ethiopia
-
 Finland
-
 France
-
 Georgia
-
 Germany
-
 Ghana
Ghana
-
 Greece
-
 Haiti
Haiti
-
 Hong Kong
-
 Hungary
-
 India
India
-
 Indonesia
-
 Iran, Islamic republic
-
 Iraq
Iraq
-
 Ireland
-
 Israel
-
 Italy
Italy
-
 Jamaica
-
 Japan
Japan
-
 Jordan
-
 Kazakhstan
-
 Kenya
Kenya
-
 Korea
Korea
-
 Kuwait
-
 Kyrgyzstan
-
 Laos
Laos
-
 Latvia
-
 Lebanon
-
 Lesotho
-
 Libya
Libya
-
 Lithuania
-
 Luxembourg
-
 Madagascar
-
 Malaysia
-
 Malta
Malta
-
 Mauritius
-
 Mexico
-
 Moldova
-
 Mongolia
-
 Montenegro
-
 Morocco
-
 Mozambique
-
 Myanmar
-
 Namibia
-
 Nepal
Nepal
-
 Netherlands
-
 New Zealand
-
 Nigeria
-
 North Macedonia
-
 Norway
-
 Oman
Oman
-
 Pakistan
-
 Palestine
-
 Panama
-
 Papua New Guinea
-
 Paraguay
-
 Peru
Peru
-
 Philippines
-
 Poland
-
 Portugal
-
 Puerto Rico
-
 Qatar
Qatar
-
 Reunion
-
 Romania
-
 Rwanda
-
 Saudi Arabia
-
 Serbia
-
 Singapore
-
 Slovakia
-
 Slovenia
-
 Somalia
-
 South Africa
-
 Spain
Spain
-
 Sri Lanka
-
 Sweden
-
 Switzerland
-
 Syria
Syria
-
 Taiwan
-
 Tajikistan
-
 Tanzania
-
 Thailand
-
 Trinidad and Tobago
-
 Tunisia
-
 Turkey
-
 UAE
UAE
-
 Uganda
-
 Ukraine
-
 United Kingdom
-
United States
-
 Uruguay
-
 Uzbekistan
-
 Venezuela
-
 Vietnam
-
 Yemen
Yemen
-
 Zambia
-
 Zimbabwe
- Forex
- Crypto











