
-3.29% for Shiba Inu — bullish signals countered by daily downside pressure

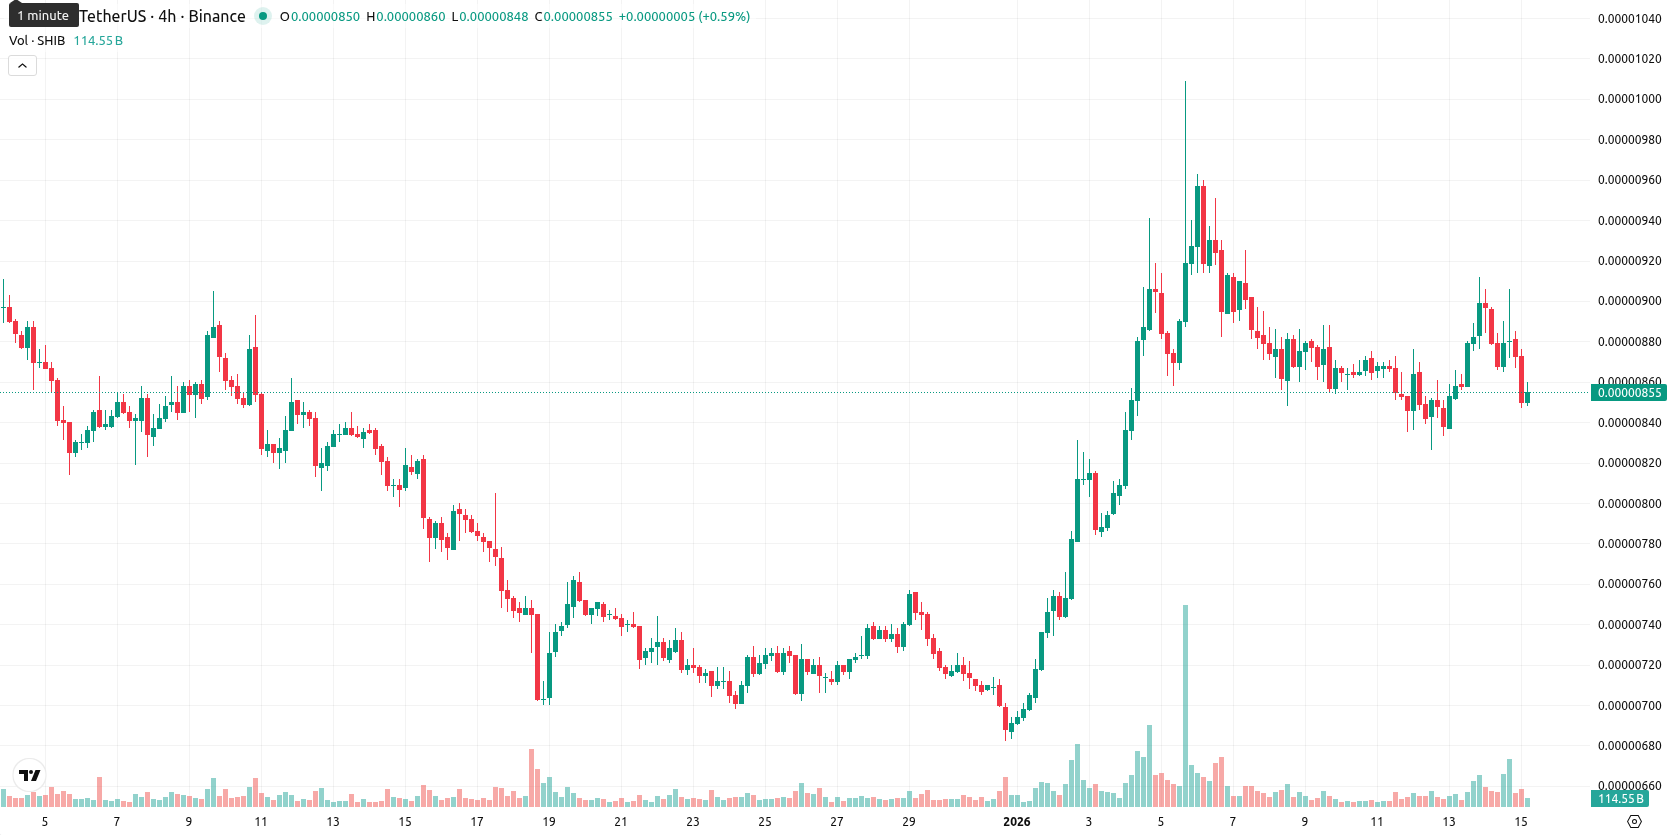
Shiba Inu (SHIB) is trading at $0.0000085, up 3.29% on the day. The price is currently above the MA-20 ($0.00000817) and MA-50 ($0.00000811) but remains well below the MA-200 ($0.00001089), indicating a short- and medium-term bullish tone even as the longer-term trend remains under pressure.
Highlights
- Shiba Inu experienced a 1,153.92% jump in hourly netflow during the Tuesday Asian session, with spot inflows reaching $144,380 against $108,020 outflows.
- Total spot net inflows for Shiba Inu over the past 24 hours totaled $2.02 million, signaling heightened market interest in the asset.
- The net gain of $36,370 in a single hour reflects growing participant engagement and could indicate increasing bullish sentiment for Shiba Inu.
Rising participant interest drives sharp uptick in spot net inflows
Shiba Inu saw a notable surge in spot net inflows, highlighted by a 1,153.92% increase in hourly netflow during the Tuesday Asian session. The platform recorded $144,380 in spot inflows and $108,020 in outflows over the hour, for a net gain of $36,370. Over the past 24 hours, total spot net inflows reached $2.02 million, reflecting growing participant interest.
Bullish momentum diverges from intraday weakness at technical thresholds
From a technical perspective, SHIB finds dynamic support at the Ichimoku Kijun ($0.00000849), with immediate resistance at the MA-5 EMA ($0.00000870). Short- and medium-term moving averages confirm positive momentum, but the price action remains constrained by the MA-200. Momentum indicators show mixed signals: MACD and ADX readings confirm an emerging trend and bullish momentum, while RSI (57) and CCI suggest modest upside that is not overbought. The Stochastic RSI near 45 flags minor near-term weakness, whereas Bull/Bear Power remains positive and the Awesome Oscillator also supports a constructive bias. Despite positive momentum readings, SHIB is trading near the low of today’s range with some downside pressure, pointing to a divergence between medium-term bullish signals and intraday softness.
Sideways outlook as breakout probability dips below key level
In the coming five sessions, SHIB is likely to stay within a volatility band of $0.00000765 to $0.00000885. A bullish scenario would require a breakout above $0.00000885, signaling renewed upward momentum, but this has a less than 20% probability based on current weekly indicators. If the price loses support at the Ichimoku Kijun ($0.00000849), bearish sentiment could increase and send SHIB toward lower support near $0.00000765. The baseline expectation is for further sideways movement within this range, acknowledging signs of both momentum and near-term weakness.
Previously it was reported that Shiba Inu continues to trade above its short- and medium-term moving averages with daily momentum indicators (MACD, ADX, RSI) signaling ongoing bullishness, although significant long-term resistance remains overhead. Despite positive momentum and dynamic support holding, increasing exchange inflows and shifting holder profitability suggest elevated downside risks and likely range-bound consolidation in the near term.


-
 Afghanistan
-
 Albania
-
 Algeria
-
 Angola
-
 Argentina
-
 Armenia
-
 Australia
-
 Austria
-
 Azerbaijan
-
 Bahamas
-
 Bahrain
-
 Bangladesh
-
 Belarus
-
 Belgium
-
 Bolivia
-
 Botswana
-
 Brazil
-
 Brunei
-
 Bulgaria
-
 Cambodia
-
 Cameroon
-
 Canada
-
 Chile
Chile
-
 China
China
-
 Colombia
-
 Congo
Congo
-
 Costa Rica
-
 Cote d'Ivoire
-
 Croatia
-
 Cuba
Cuba
-
 Cyprus
-
 Czechia
-
 DR Congo
-
 Denmark
-
 Dominican Republic
-
 Ecuador
-
 Egypt
Egypt
-
 El Salvador
-
 Estonia
-
 Eswatini
-
 Ethiopia
-
 Finland
-
 France
-
 Georgia
-
 Germany
-
 Ghana
Ghana
-
 Greece
-
 Haiti
Haiti
-
 Hong Kong
-
 Hungary
-
 India
India
-
 Indonesia
-
 Iran, Islamic republic
-
 Iraq
Iraq
-
 Ireland
-
 Israel
-
 Italy
Italy
-
 Jamaica
-
 Japan
Japan
-
 Jordan
-
 Kazakhstan
-
 Kenya
Kenya
-
 Korea
Korea
-
 Kuwait
-
 Kyrgyzstan
-
 Laos
Laos
-
 Latvia
-
 Lebanon
-
 Lesotho
-
 Libya
Libya
-
 Lithuania
-
 Luxembourg
-
 Madagascar
-
 Malaysia
-
 Malta
Malta
-
 Mauritius
-
 Mexico
-
 Moldova
-
 Mongolia
-
 Montenegro
-
 Morocco
-
 Mozambique
-
 Myanmar
-
 Namibia
-
 Nepal
Nepal
-
 Netherlands
-
 New Zealand
-
 Nigeria
-
 North Macedonia
-
 Norway
-
 Oman
Oman
-
 Pakistan
-
 Palestine
-
 Panama
-
 Papua New Guinea
-
 Paraguay
-
 Peru
Peru
-
 Philippines
-
 Poland
-
 Portugal
-
 Puerto Rico
-
 Qatar
Qatar
-
 Reunion
-
 Romania
-
 Rwanda
-
 Saudi Arabia
-
 Serbia
-
 Singapore
-
 Slovakia
-
 Slovenia
-
 Somalia
-
 South Africa
-
 Spain
Spain
-
 Sri Lanka
-
 Sweden
-
 Switzerland
-
 Syria
Syria
-
 Taiwan
-
 Tajikistan
-
 Tanzania
-
 Thailand
-
 Trinidad and Tobago
-
 Tunisia
-
 Turkey
-
 UAE
UAE
-
 Uganda
-
 Ukraine
-
 United Kingdom
-
United States
-
 Uruguay
-
 Uzbekistan
-
 Venezuela
-
 Vietnam
-
 Yemen
Yemen
-
 Zambia
-
 Zimbabwe
- Forex
- Crypto
