
-3.53% for TRUMP — mixed signals and volatile session cap gains

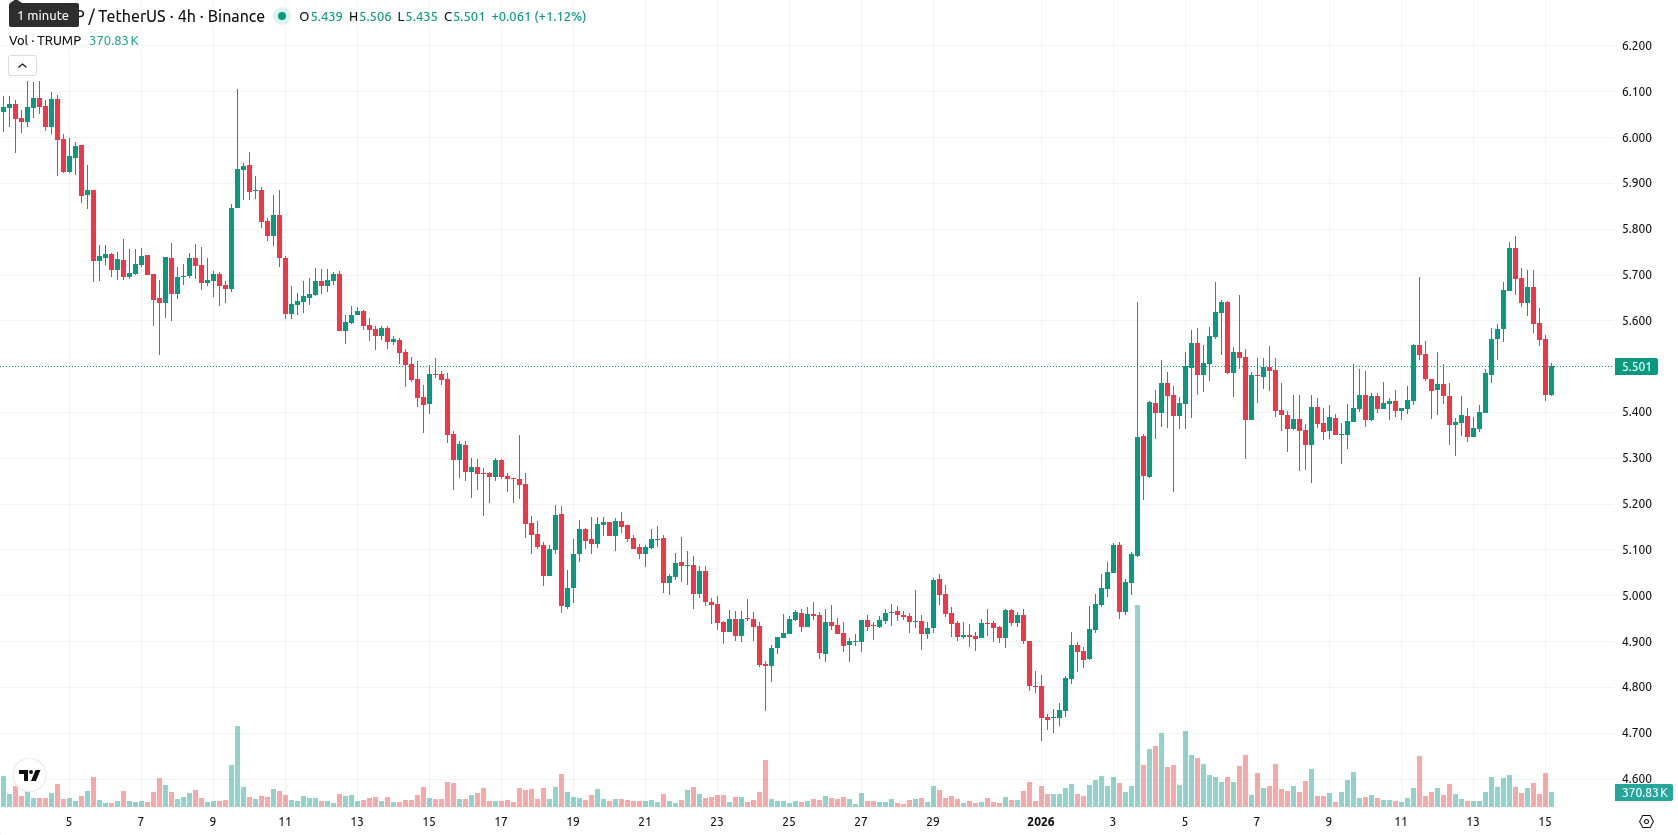
Official Trump (TRUMP) is trading at $5.49, sitting above the MA-20 ($5.24) and MA-50 ($5.43) but well below the long-term MA-200 ($7.50). This positioning underscores short- and medium-term bullish momentum, while the long-term trend remains under pressure from sellers; the nearest dynamic support lies at the Ichimoku Kijun around $5.23, with resistance next likely at the MA-50 or the psychological $5.50 mark.
Highlights
- TRUMP trades at $5.49, above the MA-20 ($5.24) and MA-50 ($5.43) but well below the long-term MA-200 ($7.50), indicating bullish short-term momentum amid a bearish long-term trend.
- Despite a modest 3.53% intraday drop and trading near the session's low of $5.42–$5.57, momentum indicators show strong buyer control even as overbought signals emerge.
- Short-term outlook projects a likely $4.98–$5.08 price corridor for the next five trading days, with less than 20% probability of a price increase given bearish weekly momentum.
Diverging momentum flags as overbought signals clash with bullish tilt
Momentum signals are mixed on the daily chart: MACD and ADX both point to modest buyer control, but overbought signals are seen from Stochastic RSI and the Commodity Channel Index, while RSI is in neutral bullish territory. Bull/Bear Power is positive, indicating buyer dominance intraday, and the Awesome Oscillator reinforces this upward tilt. TRUMP opened at $5.56, only slightly below the previous close of $5.69—no significant gap—and now trades near the bottom of today’s $5.42–$5.57 range after slipping 3.53%. Despite moderate volatility, the session has shown pressure from sellers after the open; oscillators signaling overbought conditions contrast with bullish momentum, highlighting a clear divergence that tempers near-term optimism.
Downside risk rises as sellers dominate outlook and volatility tightens
For the next five trading days, the most likely price corridor is $4.98–$5.08, adjusted to reflect the recent price action and volatility. The probability of a price increase is very low (less than 20%), making a downward move much more likely in the short term given the predominance of Sell signals in weekly momentum indicators. The baseline scenario projects sideways movement within this tight range. A bullish scenario would require a breakout above $5.57 with sustained buying pressure, while a bearish scenario could play out if support near $5.23 fails, potentially testing fresh local lows.
Last time, analysts noted that Official Trump is showing short- to medium-term bullish momentum as it trades above key short-term moving averages and sits near the top of its daily range, though it remains below longer-term trend resistance. However, overbought oscillator readings and bearish weekly indicators suggest upside is limited, with consolidation or a potential pullback likely if immediate support levels are breached.


Latest TRUMP News


-
 Afghanistan
-
 Albania
-
 Algeria
-
 Angola
-
 Argentina
-
 Armenia
-
 Australia
-
 Austria
-
 Azerbaijan
-
 Bahamas
-
 Bahrain
-
 Bangladesh
-
 Belarus
-
 Belgium
-
 Bolivia
-
 Botswana
-
 Brazil
-
 Brunei
-
 Bulgaria
-
 Cambodia
-
 Cameroon
-
 Canada
-
 Chile
Chile
-
 China
China
-
 Colombia
-
 Congo
Congo
-
 Costa Rica
-
 Cote d'Ivoire
-
 Croatia
-
 Cuba
Cuba
-
 Cyprus
-
 Czechia
-
 DR Congo
-
 Denmark
-
 Dominican Republic
-
 Ecuador
-
 Egypt
Egypt
-
 El Salvador
-
 Estonia
-
 Eswatini
-
 Ethiopia
-
 Finland
-
 France
-
 Georgia
-
 Germany
-
 Ghana
Ghana
-
 Greece
-
 Haiti
Haiti
-
 Hong Kong
-
 Hungary
-
 India
India
-
 Indonesia
-
 Iran, Islamic republic
-
 Iraq
Iraq
-
 Ireland
-
 Israel
-
 Italy
Italy
-
 Jamaica
-
 Japan
Japan
-
 Jordan
-
 Kazakhstan
-
 Kenya
Kenya
-
 Korea
Korea
-
 Kuwait
-
 Kyrgyzstan
-
 Laos
Laos
-
 Latvia
-
 Lebanon
-
 Lesotho
-
 Libya
Libya
-
 Lithuania
-
 Luxembourg
-
 Madagascar
-
 Malaysia
-
 Malta
Malta
-
 Mauritius
-
 Mexico
-
 Moldova
-
 Mongolia
-
 Montenegro
-
 Morocco
-
 Mozambique
-
 Myanmar
-
 Namibia
-
 Nepal
Nepal
-
 Netherlands
-
 New Zealand
-
 Nigeria
-
 North Macedonia
-
 Norway
-
 Oman
Oman
-
 Pakistan
-
 Palestine
-
 Panama
-
 Papua New Guinea
-
 Paraguay
-
 Peru
Peru
-
 Philippines
-
 Poland
-
 Portugal
-
 Puerto Rico
-
 Qatar
Qatar
-
 Reunion
-
 Romania
-
 Rwanda
-
 Saudi Arabia
-
 Serbia
-
 Singapore
-
 Slovakia
-
 Slovenia
-
 Somalia
-
 South Africa
-
 Spain
Spain
-
 Sri Lanka
-
 Sweden
-
 Switzerland
-
 Syria
Syria
-
 Taiwan
-
 Tajikistan
-
 Tanzania
-
 Thailand
-
 Trinidad and Tobago
-
 Tunisia
-
 Turkey
-
 UAE
UAE
-
 Uganda
-
 Ukraine
-
 United Kingdom
-
United States
-
 Uruguay
-
 Uzbekistan
-
 Venezuela
-
 Vietnam
-
 Yemen
Yemen
-
 Zambia
-
 Zimbabwe
- Forex
- Crypto
