
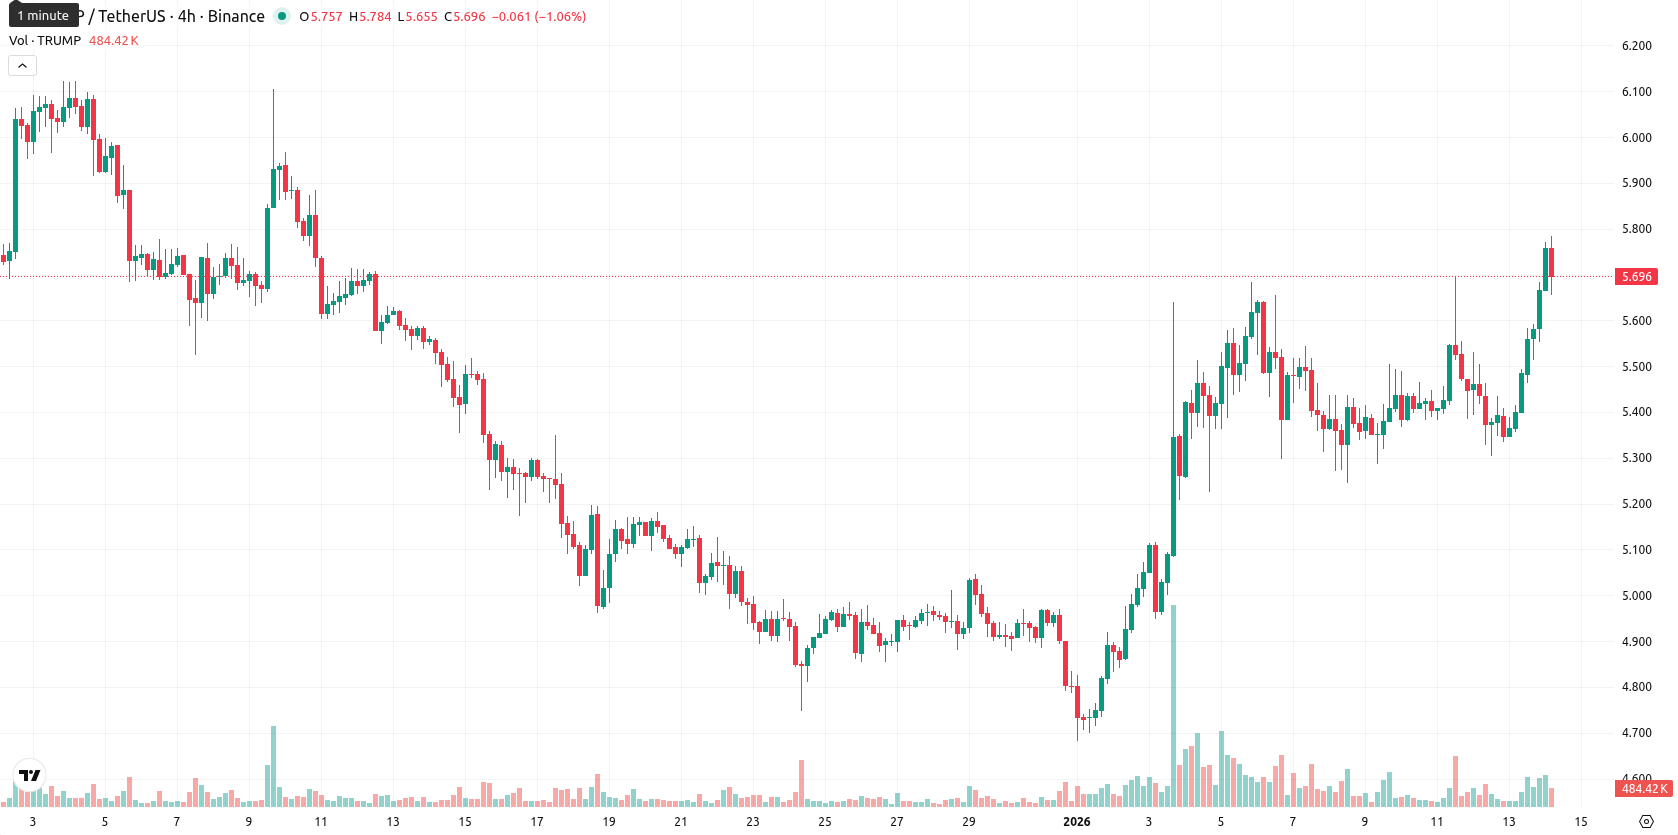
TRUMP: persistent intraday buying drives 5.66% gain despite bearish weekly signals

Official Trump (TRUMP) is trading at $5.70, which is above its MA-20 at $5.20 and MA-50 at $5.44 but remains well below the MA-200 at $7.52. This setup suggests that short- to medium-term momentum is bullish, while longer-term trend pressure from sellers persists, with dynamic support near the Ichimoku Kijun at $5.19 and resistance at the MA-50 or the $5.80 round level.
Highlights
- TRUMP trades at $5.70, above its MA-20 ($5.20) and MA-50 ($5.44) but below MA-200 ($7.52), evidencing short-term bullish momentum amid persistent long-term selling pressure.
- Momentum indicators show mild bullishness with RSI at 60.71, CCI at 94.18, and Stochastic RSI at 96.03 signaling overbought conditions, suggesting potential for a pause following the rally.
- Expected five-day trading range is $5.45 to $5.95 with a less than 20% chance of a sustained upside move; consolidation or downside toward $5.20 is more probable barring a breakout above $5.80.
Buyer dominance faces overbought signals as intraday volatility climbs
Momentum indicators show mild bullishness on the daily timeframe, with the MACD remaining neutral and the ADX reading at 20.90 indicating only modest trend strength. The RSI at 60.71 and CCI at 94.18 suggest buyers are present, but the Stochastic RSI at 96.03 flags overbought conditions. Bull/Bear Power strongly favors buyers, confirming persistent intraday buying dominance. The Awesome Oscillator also points upward, supporting this momentum. Today's session opened with a small gap up from the previous close ($5.39 to $5.67), and the current price sits near the top of the daily range ($5.66 – $5.79), highlighting moderate intraday volatility and a clear tone of sustained strength toward highs. The overbought signals in oscillators partly diverge from bullish momentum, hinting a pause or cooling off may follow the rally.
Consolidation expected as bearish weekly signals outweigh upside potential
Over the next five trading days, the expected price range is $5.45 to $5.95, keeping the current price comfortably within typical weekly volatility. There is a very low probability (less than 20%) of a sustained upside move, with downside being more likely, as major weekly indicators (RSI, ADX, MACD) all signal caution or outright bearishness. The baseline scenario is for price to consolidate sideways within this corridor. A bullish breakout above $5.80 could open the door for a test of $6.00, but overbought signals suggest profit-taking is likely before any sustained rally. A bearish scenario would see the price slip below support at $5.45, targeting short-term lows near $5.20 if sellers regain control.
Previously it was reported that Official Trump is trading just above its 20-day moving average and below the 50-day, signaling a short-term upward bias within a broader downtrend defined by the 200-day average. Mixed momentum indicators and low volatility suggest limited upside as resistance near $5.50–$5.60 remains firm, with immediate support at $5.19 highlighting downside risks if breached.


Latest TRUMP News


-
 Afghanistan
-
 Albania
-
 Algeria
-
 Angola
-
 Argentina
-
 Armenia
-
 Australia
-
 Austria
-
 Azerbaijan
-
 Bahamas
-
 Bahrain
-
 Bangladesh
-
 Belarus
-
 Belgium
-
 Bolivia
-
 Botswana
-
 Brazil
-
 Brunei
-
 Bulgaria
-
 Cambodia
-
 Cameroon
-
 Canada
-
 Chile
Chile
-
 China
China
-
 Colombia
-
 Congo
Congo
-
 Costa Rica
-
 Cote d'Ivoire
-
 Croatia
-
 Cuba
Cuba
-
 Cyprus
-
 Czechia
-
 DR Congo
-
 Denmark
-
 Dominican Republic
-
 Ecuador
-
 Egypt
Egypt
-
 El Salvador
-
 Estonia
-
 Eswatini
-
 Ethiopia
-
 Finland
-
 France
-
 Georgia
-
 Germany
-
 Ghana
Ghana
-
 Greece
-
 Haiti
Haiti
-
 Hong Kong
-
 Hungary
-
 India
India
-
 Indonesia
-
 Iran, Islamic republic
-
 Iraq
Iraq
-
 Ireland
-
 Israel
-
 Italy
Italy
-
 Jamaica
-
 Japan
Japan
-
 Jordan
-
 Kazakhstan
-
 Kenya
Kenya
-
 Korea
Korea
-
 Kuwait
-
 Kyrgyzstan
-
 Laos
Laos
-
 Latvia
-
 Lebanon
-
 Lesotho
-
 Libya
Libya
-
 Lithuania
-
 Luxembourg
-
 Madagascar
-
 Malaysia
-
 Malta
Malta
-
 Mauritius
-
 Mexico
-
 Moldova
-
 Mongolia
-
 Montenegro
-
 Morocco
-
 Mozambique
-
 Myanmar
-
 Namibia
-
 Nepal
Nepal
-
 Netherlands
-
 New Zealand
-
 Nigeria
-
 North Macedonia
-
 Norway
-
 Oman
Oman
-
 Pakistan
-
 Palestine
-
 Panama
-
 Papua New Guinea
-
 Paraguay
-
 Peru
Peru
-
 Philippines
-
 Poland
-
 Portugal
-
 Puerto Rico
-
 Qatar
Qatar
-
 Reunion
-
 Romania
-
 Rwanda
-
 Saudi Arabia
-
 Serbia
-
 Singapore
-
 Slovakia
-
 Slovenia
-
 Somalia
-
 South Africa
-
 Spain
Spain
-
 Sri Lanka
-
 Sweden
-
 Switzerland
-
 Syria
Syria
-
 Taiwan
-
 Tajikistan
-
 Tanzania
-
 Thailand
-
 Trinidad and Tobago
-
 Tunisia
-
 Turkey
-
 UAE
UAE
-
 Uganda
-
 Ukraine
-
 United Kingdom
-
United States
-
 Uruguay
-
 Uzbekistan
-
 Venezuela
-
 Vietnam
-
 Yemen
Yemen
-
 Zambia
-
 Zimbabwe
- Forex
- Crypto
