
Oversold trading limits further downside for TRUMP drop

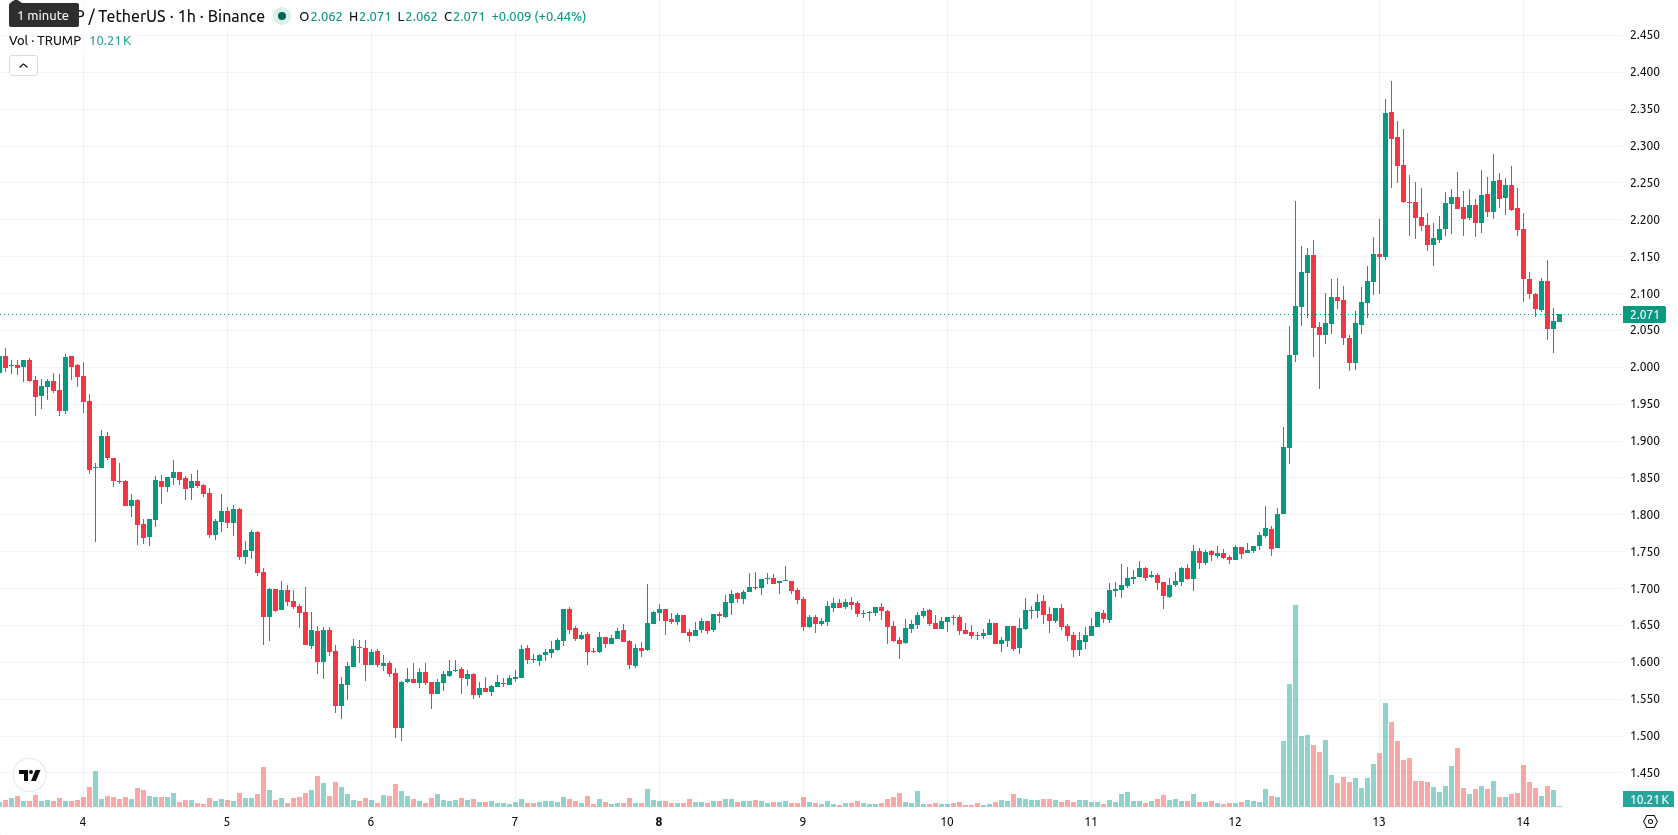
Official Trump (TRUMP) is trading at $2.06, marking a steep daily decline of 8.06%. The asset remains below its key moving averages, reflecting a continuation of recent downside momentum.
Highlights
- TRUMP remains under sustained selling pressure, trading below key moving averages across all timeframes.
- Momentum indicators are predominantly bearish, with oversold conditions signaling stretched downside but no clear buyer recovery.
- Price is expected to consolidate between $1.88 and $2.24, with a higher probability of further downside unless $2.20 is reclaimed.
Technical support erodes as mixed signals cap momentum
On the h1 timeframe, TRUMP is trading below both the MA-20 level at $2.19 and the MA-50 at $2.12, while the daily chart shows the price holding well under the MA-200 at $3.66. The Ichimoku Kijun at $2.20 represents immediate resistance. Technical momentum is mixed: ADX highlights some underlying buying interest, but the MACD is neutral, and RSI reads 41.96, indicating a sell bias. Stoch RSI and CCI are both in oversold territory, while BBP signals ongoing seller dominance and the Awesome Oscillator confirms alignment with the downward trend.
Downside bias prevails as consolidation limits rebound odds
In the short term, TRUMP is likely to consolidate within a volatility band of $1.88 to $2.24 over the next 2 to 3 trading days. Downward continuation has a higher probability, assessed at 58%, with a 42% chance of a rebound. A bullish reversal scenario would require a breakout above $2.20, while a drop below $1.88 would expose further downside risk.
Previously, analysts noted emerging uncertainty and downside risks for TRUMP as momentum signals turned mixed against a backdrop of short-term volatility. The current technical setup reinforces this cautious stance, with immediate focus now on the $1.88 support level as a decisive marker for further downside or potential short-term stabilization.


Latest TRUMP News


-
 Afghanistan
-
 Albania
-
 Algeria
-
 Angola
-
 Argentina
-
 Armenia
-
 Australia
-
 Austria
-
 Azerbaijan
-
 Bahamas
-
 Bahrain
-
 Bangladesh
-
 Belarus
-
 Belgium
-
 Bolivia
-
 Botswana
-
 Brazil
-
 Brunei
-
 Bulgaria
-
 Cambodia
-
 Cameroon
-
 Canada
-
 Chile
Chile
-
 China
China
-
 Colombia
-
 Congo
Congo
-
 Costa Rica
-
 Cote d'Ivoire
-
 Croatia
-
 Cuba
Cuba
-
 Cyprus
-
 Czechia
-
 DR Congo
-
 Denmark
-
 Dominican Republic
-
 Ecuador
-
 Egypt
Egypt
-
 El Salvador
-
 Estonia
-
 Eswatini
-
 Ethiopia
-
 Finland
-
 France
-
 Georgia
-
 Germany
-
 Ghana
Ghana
-
 Greece
-
 Haiti
Haiti
-
 Hong Kong
-
 Hungary
-
 India
India
-
 Indonesia
-
 Iran, Islamic republic
-
 Iraq
Iraq
-
 Ireland
-
 Israel
-
 Italy
Italy
-
 Jamaica
-
 Japan
Japan
-
 Jordan
-
 Kazakhstan
-
 Kenya
Kenya
-
 Korea
Korea
-
 Kuwait
-
 Kyrgyzstan
-
 Laos
Laos
-
 Latvia
-
 Lebanon
-
 Lesotho
-
 Libya
Libya
-
 Lithuania
-
 Luxembourg
-
 Madagascar
-
 Malaysia
-
 Malta
Malta
-
 Mauritius
-
 Mexico
-
 Moldova
-
 Mongolia
-
 Montenegro
-
 Morocco
-
 Mozambique
-
 Myanmar
-
 Namibia
-
 Nepal
Nepal
-
 Netherlands
-
 New Zealand
-
 Nigeria
-
 North Macedonia
-
 Norway
-
 Oman
Oman
-
 Pakistan
-
 Palestine
-
 Panama
-
 Papua New Guinea
-
 Paraguay
-
 Peru
Peru
-
 Philippines
-
 Poland
-
 Portugal
-
 Puerto Rico
-
 Qatar
Qatar
-
 Reunion
-
 Romania
-
 Rwanda
-
 Saudi Arabia
-
 Serbia
-
 Singapore
-
 Slovakia
-
 Slovenia
-
 Somalia
-
 South Africa
-
 Spain
Spain
-
 Sri Lanka
-
 Sweden
-
 Switzerland
-
 Syria
Syria
-
 Taiwan
-
 Tajikistan
-
 Tanzania
-
 Thailand
-
 Trinidad and Tobago
-
 Tunisia
-
 Turkey
-
 UAE
UAE
-
 Uganda
-
 Ukraine
-
 United Kingdom
-
United States
-
 Uruguay
-
 Uzbekistan
-
 Venezuela
-
 Vietnam
-
 Yemen
Yemen
-
 Zambia
-
 Zimbabwe
- Forex
- Crypto
