
Polkadot advances 3.28% as technicals show lingering bearish pressure and weak momentum

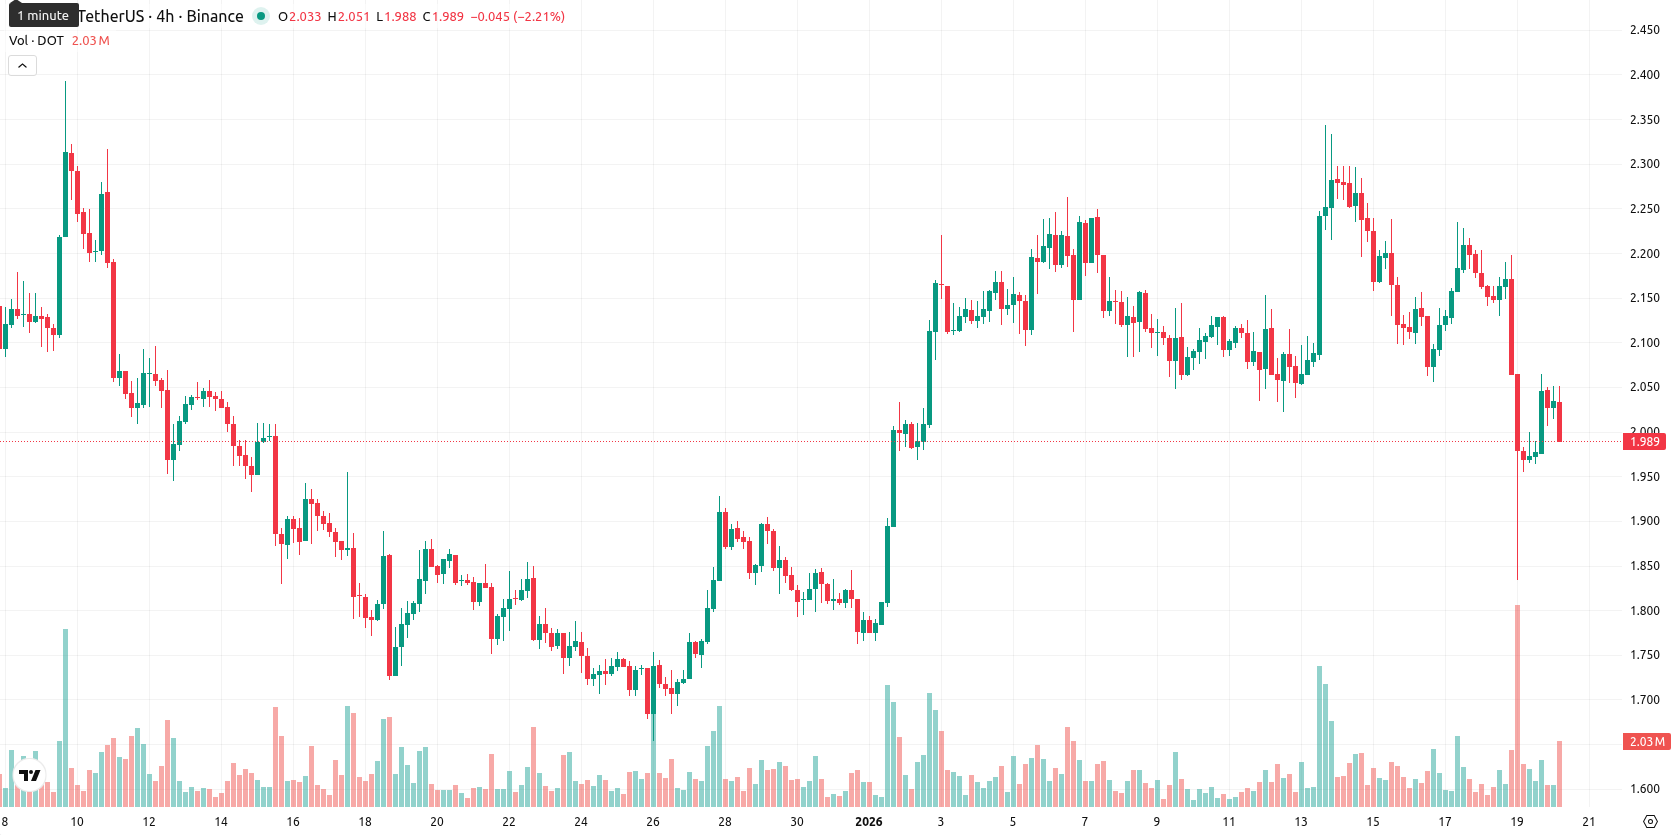
Polkadot (DOT) is trading at $2.018, up 3.28% from the previous close of $1.954. DOT remains below the MA-20 ($2.112) and just under the MA-50 ($2.023), while staying well beneath the long-term MA-200 ($3.201), highlighting persistent short- and medium-term bearish dynamics.
Highlights
- Polkadot (DOT) is trading at $2.018, below the MA-20 ($2.112), MA-50 ($2.023), and significantly under the MA-200 ($3.201), signaling ongoing bearish pressure.
- Momentum signals are mixed, with a daily MACD Strong Buy contrasted by neutral ADX, oversold RSI (47.26) and CCI (–122.32), and persistent selling dominance on the intraday bull/bear power.
- DOT is forecast to consolidate between $1.94 and $2.10 over the next five days, with less than 20% probability of a significant price increase and bearish scenarios favored if $1.94 support fails.
Oversold conditions meet weakening momentum across indicators
The technical picture for DOT shows it trapped beneath all major moving averages, with the Ichimoku Kijun at $1.998 acting as immediate dynamic support and the MA-50 at $2.023 as the first overhead resistance. Momentum indicators are mixed: the MACD on daily is on a Strong Buy, while the ADX stays Neutral, signaling weak overall trend strength. The RSI at 47.26 and CCI at –122.32 both indicate mild to notable oversold levels, joined by a more pronounced oversold signal on the Stochastic RSI. Bull/Bear Power tips toward mild intraday selling dominance, agreeing with the BBP's daily Sell signal, while the Awesome Oscillator remains Neutral and does not reinforce directionality.
Consolidation likely as low volatility limits upside
In the near term, DOT is expected to fluctuate within a volatility band from $1.94 to $2.10, reflecting typical movement given recent low volatility. The likelihood of a significant price rise remains low (under 20%), as signals from multiple timeframes continue to favor bearish or sideways action. The base scenario points to ongoing consolidation between support at $1.94 and resistance at $2.10. A push above $2.10 could set up a move toward $2.15, while a drop below $1.94 may trigger a retest of recent lows near $1.93 amid intensified selling pressure.
Last time, analysts noted that Polkadot is trading below its short-, medium-, and long-term moving averages, with persistent bearish pressure and a strongly negative long-term trend. Technical indicators are mixed—MACD is flat, ADX is low, and while support aligns near $1.998 and resistance sits at $2.029, volatility remains high and the near-term outlook is indecisive with sellers prevailing intraday.


Latest Polkadot News


-
 Afghanistan
-
 Albania
-
 Algeria
-
 Angola
-
 Argentina
-
 Armenia
-
 Australia
-
 Austria
-
 Azerbaijan
-
 Bahamas
-
 Bahrain
-
 Bangladesh
-
 Belarus
-
 Belgium
-
 Bolivia
-
 Botswana
-
 Brazil
-
 Brunei
-
 Bulgaria
-
 Cambodia
-
 Cameroon
-
 Canada
-
 Chile
Chile
-
 China
China
-
 Colombia
-
 Congo
Congo
-
 Costa Rica
-
 Cote d'Ivoire
-
 Croatia
-
 Cuba
Cuba
-
 Cyprus
-
 Czechia
-
 DR Congo
-
 Denmark
-
 Dominican Republic
-
 Ecuador
-
 Egypt
Egypt
-
 El Salvador
-
 Estonia
-
 Eswatini
-
 Ethiopia
-
 Finland
-
 France
-
 Georgia
-
 Germany
-
 Ghana
Ghana
-
 Greece
-
 Haiti
Haiti
-
 Hong Kong
-
 Hungary
-
 India
India
-
 Indonesia
-
 Iran, Islamic republic
-
 Iraq
Iraq
-
 Ireland
-
 Israel
-
 Italy
Italy
-
 Jamaica
-
 Japan
Japan
-
 Jordan
-
 Kazakhstan
-
 Kenya
Kenya
-
 Korea
Korea
-
 Kuwait
-
 Kyrgyzstan
-
 Laos
Laos
-
 Latvia
-
 Lebanon
-
 Lesotho
-
 Libya
Libya
-
 Lithuania
-
 Luxembourg
-
 Madagascar
-
 Malaysia
-
 Malta
Malta
-
 Mauritius
-
 Mexico
-
 Moldova
-
 Mongolia
-
 Montenegro
-
 Morocco
-
 Mozambique
-
 Myanmar
-
 Namibia
-
 Nepal
Nepal
-
 Netherlands
-
 New Zealand
-
 Nigeria
-
 North Macedonia
-
 Norway
-
 Oman
Oman
-
 Pakistan
-
 Palestine
-
 Panama
-
 Papua New Guinea
-
 Paraguay
-
 Peru
Peru
-
 Philippines
-
 Poland
-
 Portugal
-
 Puerto Rico
-
 Qatar
Qatar
-
 Reunion
-
 Romania
-
 Rwanda
-
 Saudi Arabia
-
 Serbia
-
 Singapore
-
 Slovakia
-
 Slovenia
-
 Somalia
-
 South Africa
-
 Spain
Spain
-
 Sri Lanka
-
 Sweden
-
 Switzerland
-
 Syria
Syria
-
 Taiwan
-
 Tajikistan
-
 Tanzania
-
 Thailand
-
 Trinidad and Tobago
-
 Tunisia
-
 Turkey
-
 UAE
UAE
-
 Uganda
-
 Ukraine
-
 United Kingdom
-
United States
-
 Uruguay
-
 Uzbekistan
-
 Venezuela
-
 Vietnam
-
 Yemen
Yemen
-
 Zambia
-
 Zimbabwe
- Forex
- Crypto
