
Polkadot trades lower as community weighs OpenGov staking proposals: weekly review

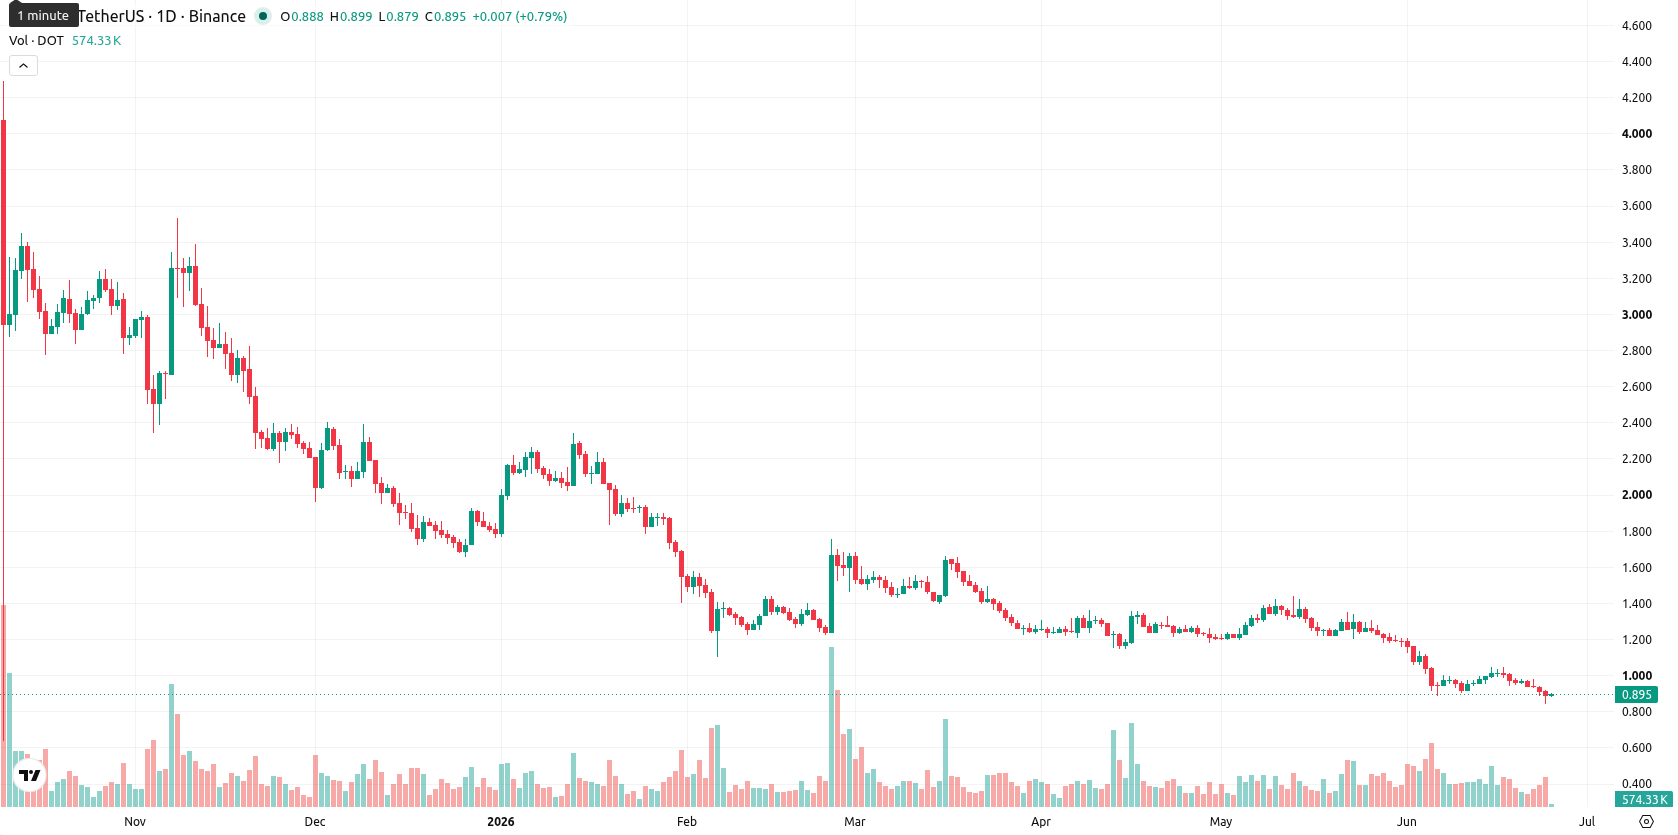
Polkadot (DOT) is currently trading at $0.894, recording a loss of $0.0820 or 8.50% for the week. The price sits notably below its MA-20 ($1.241), MA-50 ($2.307), and MA-200 ($4.904) on the weekly chart, confirming a strong bearish trend and persistent downward pressure.
Highlights
- Polkadot remains in a pronounced downtrend, trading well below key moving averages and reflecting sustained bearish momentum.
- Bearish signals from momentum and oscillators dominate, with oversold conditions but no indication of an imminent reversal.
- DOT is expected to consolidate between $0.75 and $1.05 over the next week, with downside risks prevailing and any recovery unlikely without a breakout above $1.05.
Validator reforms and staking updates fuel debate on network incentives
The Polkadot ecosystem is undergoing community debate regarding critical updates to its staking system through OpenGov Referenda 1909 and 1910. Proposed changes include setting a minimum self-stake requirement of 10,000 DOT for validators, adding rewards for those who lock capital, and introducing the ability to remove under-collateralized validators, all designed to strengthen network security and realign incentives. Safeguards to keep the validator set above critical operational levels are also part of these initiatives, which align with broader efforts to balance security and user participation across blockchain platforms.
Bearish momentum dominates as indicators and averages align lower
All weekly technical indicators reinforce the prevailing bearish sentiment. DOT remains far below its weekly MA-20, MA-50, and MA-200 levels, with the nearest dynamic resistance at the MA-20 ($1.241). Weekly support lies near $0.75 and resistance at $1.05. Momentum oscillators, including MACD, ADX, RSI, CCI, and Stochastic RSI, confirm strong selling pressure and oversold conditions, while Bull/Bear Power and the Awesome Oscillator underscore the dominance of sellers.
Further downside favored amid volatility and weak reversal signals
Over the next 7 days, DOT is forecast to consolidate between $0.75 and $1.05, tracking the current elevated weekly volatility. With none of the key momentum indicators signaling a buy, the probability of a sustained upward move remains below 20%, making further declines more likely. A break above $1.05 would be required to shift the short-term trend bullish, while a move below $0.75 could accelerate additional downside.
Earlier, analysts noted that Polkadot continued to face persistent downside risks amid prevailing bearish momentum. With the latest weekly technicals and ecosystem developments reinforcing this outlook, traders should monitor for either a sustained move below $0.75—signaling additional downside—or an unexpected breakout above $1.05 to challenge the bearish trend.


-
 Afghanistan
-
 Albania
-
 Algeria
-
 Angola
-
 Argentina
-
 Armenia
-
 Australia
-
 Austria
-
 Azerbaijan
-
 Bahamas
-
 Bahrain
-
 Bangladesh
-
 Belarus
-
 Belgium
-
 Bolivia
-
 Botswana
-
 Brazil
-
 Brunei
-
 Bulgaria
-
 Cambodia
-
 Cameroon
-
 Canada
-
 Chile
Chile
-
 China
China
-
 Colombia
-
 Congo
Congo
-
 Costa Rica
-
 Cote d'Ivoire
-
 Croatia
-
 Cuba
Cuba
-
 Cyprus
-
 Czechia
-
 DR Congo
-
 Denmark
-
 Dominican Republic
-
 Ecuador
-
 Egypt
Egypt
-
 El Salvador
-
 Estonia
-
 Eswatini
-
 Ethiopia
-
 Finland
-
 France
-
 Georgia
-
 Germany
-
 Ghana
Ghana
-
 Greece
-
 Haiti
Haiti
-
 Hong Kong
-
 Hungary
-
 India
India
-
 Indonesia
-
 Iran, Islamic republic
-
 Iraq
Iraq
-
 Ireland
-
 Israel
-
 Italy
Italy
-
 Jamaica
-
 Japan
Japan
-
 Jordan
-
 Kazakhstan
-
 Kenya
Kenya
-
 Korea
Korea
-
 Kuwait
-
 Kyrgyzstan
-
 Laos
Laos
-
 Latvia
-
 Lebanon
-
 Lesotho
-
 Libya
Libya
-
 Lithuania
-
 Luxembourg
-
 Madagascar
-
 Malaysia
-
 Malta
Malta
-
 Mauritius
-
 Mexico
-
 Moldova
-
 Mongolia
-
 Montenegro
-
 Morocco
-
 Mozambique
-
 Myanmar
-
 Namibia
-
 Nepal
Nepal
-
 Netherlands
-
 New Zealand
-
 Nigeria
-
 North Macedonia
-
 Norway
-
 Oman
Oman
-
 Pakistan
-
 Palestine
-
 Panama
-
 Papua New Guinea
-
 Paraguay
-
 Peru
Peru
-
 Philippines
-
 Poland
-
 Portugal
-
 Puerto Rico
-
 Qatar
Qatar
-
 Reunion
-
 Romania
-
 Rwanda
-
 Saudi Arabia
-
 Serbia
-
 Singapore
-
 Slovakia
-
 Slovenia
-
 Somalia
-
 South Africa
-
 Spain
Spain
-
 Sri Lanka
-
 Sweden
-
 Switzerland
-
 Syria
Syria
-
 Taiwan
-
 Tajikistan
-
 Tanzania
-
 Thailand
-
 Trinidad and Tobago
-
 Tunisia
-
 Turkey
-
 UAE
UAE
-
 Uganda
-
 Ukraine
-
 United Kingdom
-
United States
-
 Uruguay
-
 Uzbekistan
-
 Venezuela
-
 Vietnam
-
 Yemen
Yemen
-
 Zambia
-
 Zimbabwe
- Forex
- Crypto
