
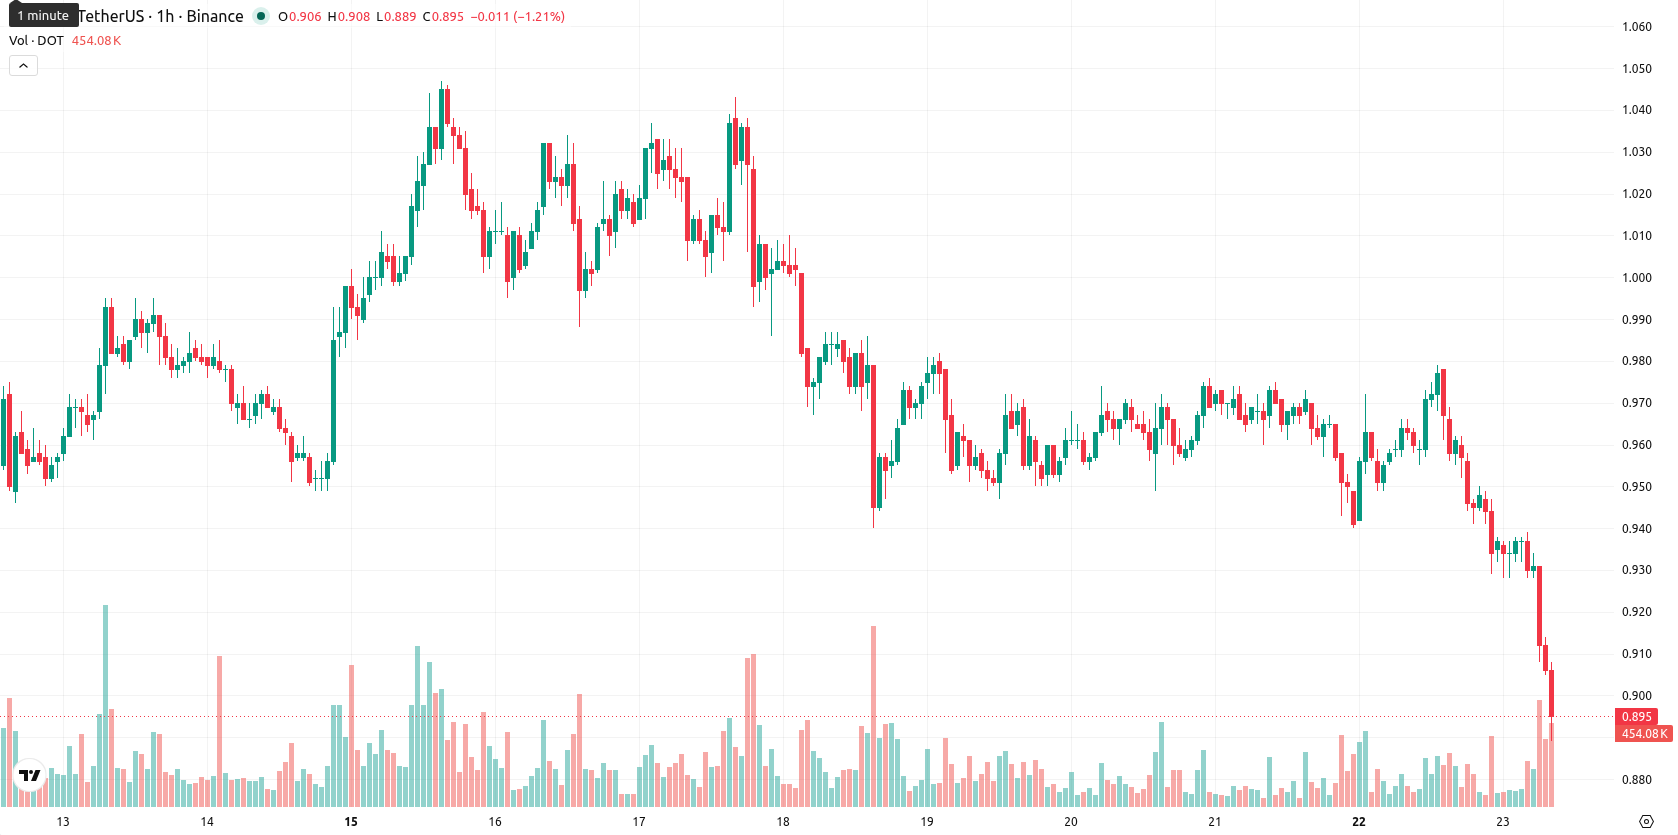
Polkadot drops 7.57% as sellers keep control below $0.916

Polkadot (DOT) is trading at $0.891, representing a decline of 7.57% from the previous close and holding near today's session lows. The asset remains under its key moving averages, indicating continued downward pressure.
Highlights
- DOT/USD faces persistent selling pressure, trading well below key moving averages and near the day's low at $0.891.
- Momentum indicators confirm a strong bearish trend, with oversold conditions and no sign of buyer strength emerging intraday.
- The pair is expected to stabilize or decline further within the $0.866–0.916 range, with a potential breakdown below $0.866 accelerating losses.
Weak momentum and oversold signals reinforce downside risk
DOT/USD currently trades below the MA-20 ($0.943) and MA-50 ($0.955) on the hourly chart, with price markedly under the long-term MA-200 at $1.485. The nearest resistance is defined by the Ichimoku Kijun at $0.943. Momentum signals are decisively weak: the MACD and ADX both present a sell bias, RSI sits at 23.942, and oversold conditions are confirmed by both CCI and Stoch RSI. BBP indicates seller dominance, and the Awesome Oscillator confirms a prevailing downtrend, all while DOT trades near the intraday low amid significant volatility.
Sideways bias persists as volatility shapes immediate outlook
The expected trading range for DOT/USD over the next 2–3 sessions is $0.866 to $0.916, reflecting typical volatility relative to current levels. A move above $0.943 would signal the first test of immediate resistance and could lead to higher price targets if successful, whereas a breakdown below $0.866 would likely accelerate further declines. The baseline scenario sees DOT/USD stabilizing sideways within this projected band as selling pressure remains the dominant force.
Earlier, analysts noted that Polkadot remained locked in a bearish outlook, with technical indicators pointing toward persistent downside risks. The latest price action and momentum readings not only reinforce this bearish scenario but also highlight the importance of monitoring for a sustained move below $0.866, which could trigger a steeper decline in the sessions ahead.


Latest Polkadot News


-
 Afghanistan
-
 Albania
-
 Algeria
-
 Angola
-
 Argentina
-
 Armenia
-
 Australia
-
 Austria
-
 Azerbaijan
-
 Bahamas
-
 Bahrain
-
 Bangladesh
-
 Belarus
-
 Belgium
-
 Bolivia
-
 Botswana
-
 Brazil
-
 Brunei
-
 Bulgaria
-
 Cambodia
-
 Cameroon
-
 Canada
-
 Chile
Chile
-
 China
China
-
 Colombia
-
 Congo
Congo
-
 Costa Rica
-
 Cote d'Ivoire
-
 Croatia
-
 Cuba
Cuba
-
 Cyprus
-
 Czechia
-
 DR Congo
-
 Denmark
-
 Dominican Republic
-
 Ecuador
-
 Egypt
Egypt
-
 El Salvador
-
 Estonia
-
 Eswatini
-
 Ethiopia
-
 Finland
-
 France
-
 Georgia
-
 Germany
-
 Ghana
Ghana
-
 Greece
-
 Haiti
Haiti
-
 Hong Kong
-
 Hungary
-
 India
India
-
 Indonesia
-
 Iran, Islamic republic
-
 Iraq
Iraq
-
 Ireland
-
 Israel
-
 Italy
Italy
-
 Jamaica
-
 Japan
Japan
-
 Jordan
-
 Kazakhstan
-
 Kenya
Kenya
-
 Korea
Korea
-
 Kuwait
-
 Kyrgyzstan
-
 Laos
Laos
-
 Latvia
-
 Lebanon
-
 Lesotho
-
 Libya
Libya
-
 Lithuania
-
 Luxembourg
-
 Madagascar
-
 Malaysia
-
 Malta
Malta
-
 Mauritius
-
 Mexico
-
 Moldova
-
 Mongolia
-
 Montenegro
-
 Morocco
-
 Mozambique
-
 Myanmar
-
 Namibia
-
 Nepal
Nepal
-
 Netherlands
-
 New Zealand
-
 Nigeria
-
 North Macedonia
-
 Norway
-
 Oman
Oman
-
 Pakistan
-
 Palestine
-
 Panama
-
 Papua New Guinea
-
 Paraguay
-
 Peru
Peru
-
 Philippines
-
 Poland
-
 Portugal
-
 Puerto Rico
-
 Qatar
Qatar
-
 Reunion
-
 Romania
-
 Rwanda
-
 Saudi Arabia
-
 Serbia
-
 Singapore
-
 Slovakia
-
 Slovenia
-
 Somalia
-
 South Africa
-
 Spain
Spain
-
 Sri Lanka
-
 Sweden
-
 Switzerland
-
 Syria
Syria
-
 Taiwan
-
 Tajikistan
-
 Tanzania
-
 Thailand
-
 Trinidad and Tobago
-
 Tunisia
-
 Turkey
-
 UAE
UAE
-
 Uganda
-
 Ukraine
-
 United Kingdom
-
United States
-
 Uruguay
-
 Uzbekistan
-
 Venezuela
-
 Vietnam
-
 Yemen
Yemen
-
 Zambia
-
 Zimbabwe
- Forex
- Crypto
