
Toncoin price prediction: Sideways or lower as TON extends intraday decline

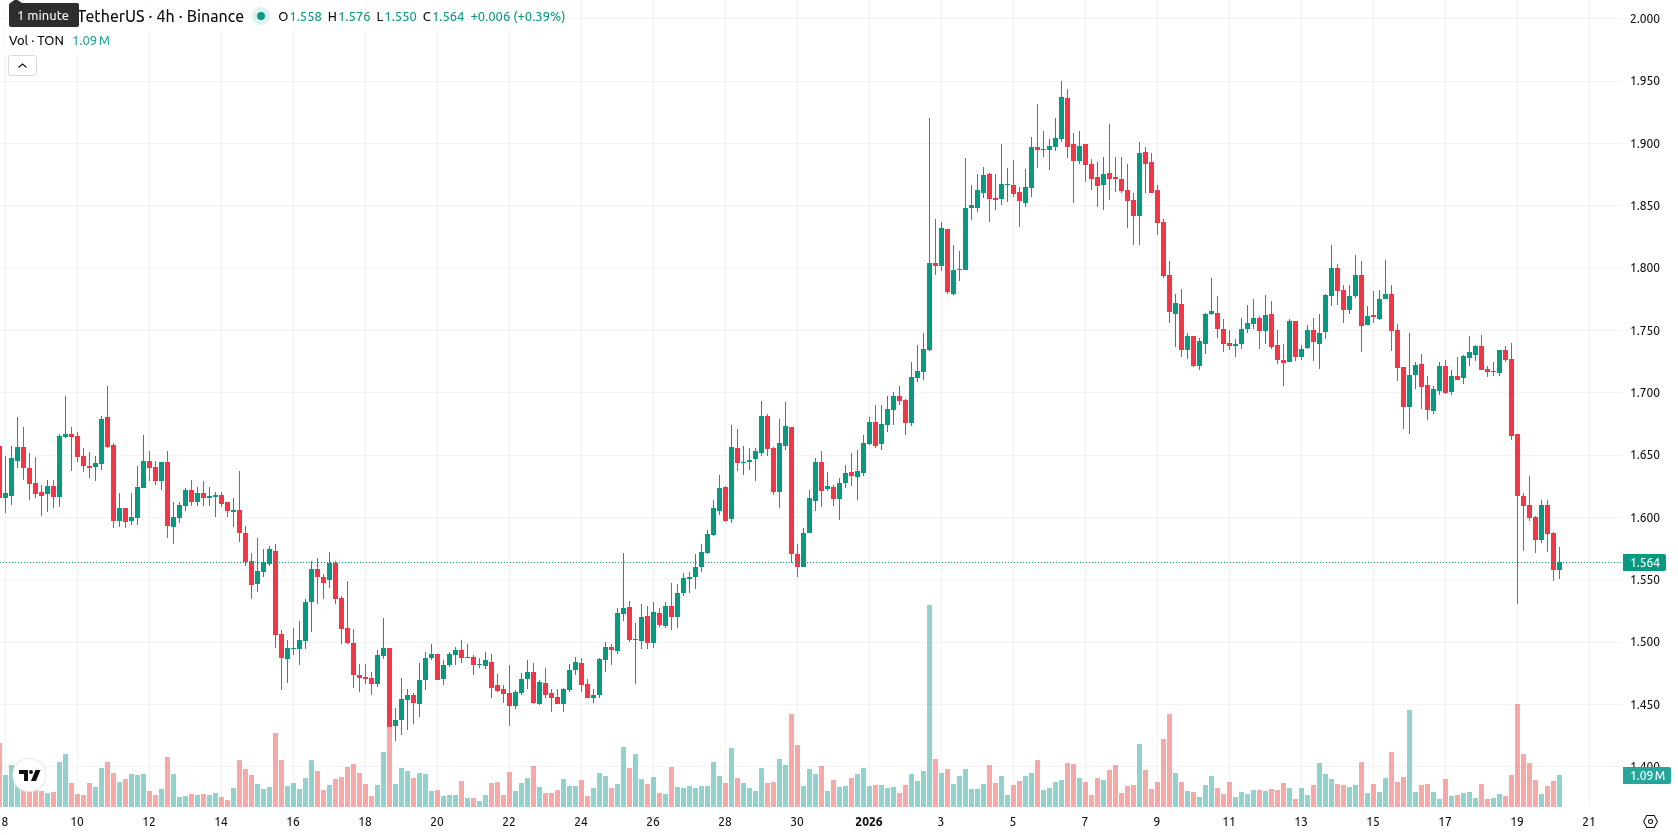
Toncoin (TON) is trading at $1.564, down 2.13% for the session. The asset remains well below the MA-20 at $1.765, the MA-50 at $1.642, and the MA-200 at $2.457, confirming a consistent downtrend across all key timeframes as sellers maintain control.
Highlights
- Toncoin trades at $1.564, significantly below the MA-20 at $1.765, MA-50 at $1.642, and MA-200 at $2.457, confirming a clear multi-timeframe downtrend.
- Momentum indicators, including RSI, Stochastic RSI, and CCI, signal oversold conditions, but weak ADX at 21.31 and negative Bull/Bear Power show sellers firmly control near-term direction.
- Toncoin is likely to remain in a $1.55 to $1.65 range over the next five trading days, with less than a 20% probability of a sustained price increase.
Oversold signals persist as sellers dominate near-session lows
Momentum indicators highlight continued weakness for TON. The daily MACD remains neutral, while the ADX at 21.31 still favors sellers, though the trend lacks overwhelming strength. RSI, Stochastic RSI, and CCI all indicate oversold conditions, but the CCI and Stochastic RSI underline strong selling pressure. Bull/Bear Power is in negative territory, confirming intraday seller dominance as the asset trades near session lows with moderate volatility; the MA-50 at $1.642 and Ichimoku Kijun at $1.707 act as immediate resistance levels.
Sideways action likely as low upside probability constrains moves
Over the next five trading days, TON is expected to remain in a typical volatility band of $1.55 to $1.65. Major weekly indicators suggest less than a 20% chance for a substantial price increase, making sideways movement within this range the baseline scenario as oversold conditions may slow additional declines. A push above the $1.65 — $1.70 resistance zone is needed to trigger upside momentum, while a breakdown below $1.55 could lead to deeper losses.
Previously it was reported that Toncoin is trading below key short- and medium-term moving averages with ongoing bearish momentum, as technical indicators such as RSI and ADX reflect weak trend strength and a tilt toward downside risk. Despite some intraday buying interest and mixed momentum signals, the asset is expected to remain rangebound between support near $1.55 and resistance at $1.70, with a low probability of an imminent breakout.


-
 Afghanistan
-
 Albania
-
 Algeria
-
 Angola
-
 Argentina
-
 Armenia
-
 Australia
-
 Austria
-
 Azerbaijan
-
 Bahamas
-
 Bahrain
-
 Bangladesh
-
 Belarus
-
 Belgium
-
 Bolivia
-
 Botswana
-
 Brazil
-
 Brunei
-
 Bulgaria
-
 Cambodia
-
 Cameroon
-
 Canada
-
 Chile
Chile
-
 China
China
-
 Colombia
-
 Congo
Congo
-
 Costa Rica
-
 Cote d'Ivoire
-
 Croatia
-
 Cuba
Cuba
-
 Cyprus
-
 Czechia
-
 DR Congo
-
 Denmark
-
 Dominican Republic
-
 Ecuador
-
 Egypt
Egypt
-
 El Salvador
-
 Estonia
-
 Eswatini
-
 Ethiopia
-
 Finland
-
 France
-
 Georgia
-
 Germany
-
 Ghana
Ghana
-
 Greece
-
 Haiti
Haiti
-
 Hong Kong
-
 Hungary
-
 India
India
-
 Indonesia
-
 Iran, Islamic republic
-
 Iraq
Iraq
-
 Ireland
-
 Israel
-
 Italy
Italy
-
 Jamaica
-
 Japan
Japan
-
 Jordan
-
 Kazakhstan
-
 Kenya
Kenya
-
 Korea
Korea
-
 Kuwait
-
 Kyrgyzstan
-
 Laos
Laos
-
 Latvia
-
 Lebanon
-
 Lesotho
-
 Libya
Libya
-
 Lithuania
-
 Luxembourg
-
 Madagascar
-
 Malaysia
-
 Malta
Malta
-
 Mauritius
-
 Mexico
-
 Moldova
-
 Mongolia
-
 Montenegro
-
 Morocco
-
 Mozambique
-
 Myanmar
-
 Namibia
-
 Nepal
Nepal
-
 Netherlands
-
 New Zealand
-
 Nigeria
-
 North Macedonia
-
 Norway
-
 Oman
Oman
-
 Pakistan
-
 Palestine
-
 Panama
-
 Papua New Guinea
-
 Paraguay
-
 Peru
Peru
-
 Philippines
-
 Poland
-
 Portugal
-
 Puerto Rico
-
 Qatar
Qatar
-
 Reunion
-
 Romania
-
 Rwanda
-
 Saudi Arabia
-
 Serbia
-
 Singapore
-
 Slovakia
-
 Slovenia
-
 Somalia
-
 South Africa
-
 Spain
Spain
-
 Sri Lanka
-
 Sweden
-
 Switzerland
-
 Syria
Syria
-
 Taiwan
-
 Tajikistan
-
 Tanzania
-
 Thailand
-
 Trinidad and Tobago
-
 Tunisia
-
 Turkey
-
 UAE
UAE
-
 Uganda
-
 Ukraine
-
 United Kingdom
-
United States
-
 Uruguay
-
 Uzbekistan
-
 Venezuela
-
 Vietnam
-
 Yemen
Yemen
-
 Zambia
-
 Zimbabwe
- Forex
- Crypto
