
DOT weekly forecast: sustained selling keeps price below moving averages — downside risk stays elevated

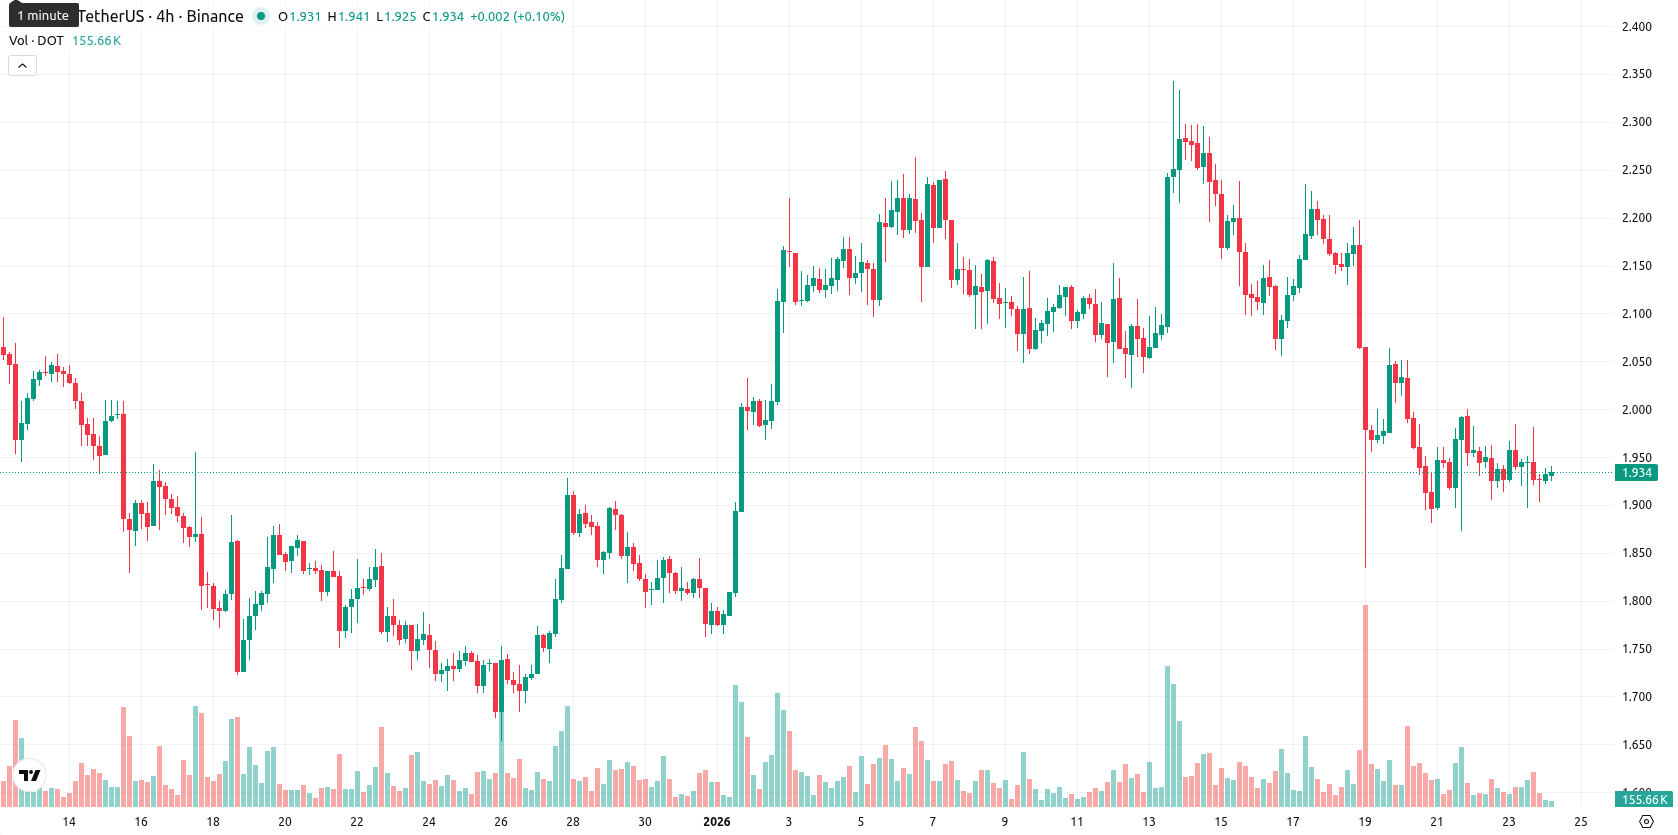
Polkadot (DOT) closed the week at $1.924, marking a sharp 13.33% decline from last week’s range of $1.834 to $2.203. The asset continues to trade well below its weekly MA-20 ($2.887), MA-50 ($3.646), and MA-200 ($6.067), signaling persistent selling pressure as DOT remains near recent lows and under all key moving averages.
Highlights
- DOT trades at $1.924, well below MA-20 ($2.887), MA-50 ($3.646), and MA-200 ($6.067), underscoring broad-based selling pressure.
- Weekly MACD (–0.691), ADX (23.6), and RSI (38.7) confirm a dominant downside trend with minimal probability of a bullish reversal.
- Key support rests at $1.84; a close below this level could trigger new lows, while resistance stands at $2.12 with negligible breakout probability.
Ecosystem upgrades and ETF reviews spark attention amid steady development
Recent network upgrades for DOT included the rollout of v2.0.5 runtime, integrating Ethereum-compatible development tools and enabling Elastic Scaling to enhance transaction throughput. The project’s treasury now manages over $70 million to support ecosystem development, and robust developer activity is evident with nearly 8,900 contributors and an active hackathon scene. Additionally, ETF products from Grayscale and 21Shares are under SEC review, with the 21Shares product’s initial seed creation set at $25 per share.
Ongoing bearish momentum confirmed as technical signals intensify this week
Technical analysis on the weekly timeframe underscores DOT’s sustained downward momentum, with prices staying far below the MA-20, MA-50, and MA-200. Momentum indicators on the W1 chart remain bearish: the MACD is deep in negative territory at –0.691, and the ADX at 23.6 verifies a strong downside trend. Oscillator readings, including an RSI at 38.7 and a CCI at –64.8, confirm prevailing weakness, while bull-bear power at –0.070 highlights continued seller dominance. The Awesome Oscillator remains neutral, and DOT closed near the weekly low, pointing to heightened volatility and persistent selling.
Bearish bias and breakout risk persist amid expected range-bound trade
For the next 5–7 trading days, DOT is expected to move within a volatile range of $1.84 to $2.12, reflecting the ongoing bearish bias from weekly momentum signals. The probability of a price rebound above $2.12 remains low (less than 20%), while further declines below $1.84 are more likely given the lack of bullish support. The base scenario points to sideways action between these levels, with any meaningful upside requiring a breakout above dynamic resistance and clear momentum reversal signals.
Last time, analysts noted that Polkadot remains below its key short-, medium-, and long-term moving averages, reinforcing ongoing bearish momentum despite a slight price uptick. Technical indicators are mixed—MACD is bullish while RSI, CCI, and Stochastics signal oversold conditions—suggesting continued consolidation between support at $1.94 and resistance at $2.10 as low volatility constrains upside potential.


Latest Polkadot News


-
 Afghanistan
-
 Albania
-
 Algeria
-
 Angola
-
 Argentina
-
 Armenia
-
 Australia
-
 Austria
-
 Azerbaijan
-
 Bahamas
-
 Bahrain
-
 Bangladesh
-
 Belarus
-
 Belgium
-
 Bolivia
-
 Botswana
-
 Brazil
-
 Brunei
-
 Bulgaria
-
 Cambodia
-
 Cameroon
-
 Canada
-
 Chile
Chile
-
 China
China
-
 Colombia
-
 Congo
Congo
-
 Costa Rica
-
 Cote d'Ivoire
-
 Croatia
-
 Cuba
Cuba
-
 Cyprus
-
 Czechia
-
 DR Congo
-
 Denmark
-
 Dominican Republic
-
 Ecuador
-
 Egypt
Egypt
-
 El Salvador
-
 Estonia
-
 Eswatini
-
 Ethiopia
-
 Finland
-
 France
-
 Georgia
-
 Germany
-
 Ghana
Ghana
-
 Greece
-
 Haiti
Haiti
-
 Hong Kong
-
 Hungary
-
 India
India
-
 Indonesia
-
 Iran, Islamic republic
-
 Iraq
Iraq
-
 Ireland
-
 Israel
-
 Italy
Italy
-
 Jamaica
-
 Japan
Japan
-
 Jordan
-
 Kazakhstan
-
 Kenya
Kenya
-
 Korea
Korea
-
 Kuwait
-
 Kyrgyzstan
-
 Laos
Laos
-
 Latvia
-
 Lebanon
-
 Lesotho
-
 Libya
Libya
-
 Lithuania
-
 Luxembourg
-
 Madagascar
-
 Malaysia
-
 Malta
Malta
-
 Mauritius
-
 Mexico
-
 Moldova
-
 Mongolia
-
 Montenegro
-
 Morocco
-
 Mozambique
-
 Myanmar
-
 Namibia
-
 Nepal
Nepal
-
 Netherlands
-
 New Zealand
-
 Nigeria
-
 North Macedonia
-
 Norway
-
 Oman
Oman
-
 Pakistan
-
 Palestine
-
 Panama
-
 Papua New Guinea
-
 Paraguay
-
 Peru
Peru
-
 Philippines
-
 Poland
-
 Portugal
-
 Puerto Rico
-
 Qatar
Qatar
-
 Reunion
-
 Romania
-
 Rwanda
-
 Saudi Arabia
-
 Serbia
-
 Singapore
-
 Slovakia
-
 Slovenia
-
 Somalia
-
 South Africa
-
 Spain
Spain
-
 Sri Lanka
-
 Sweden
-
 Switzerland
-
 Syria
Syria
-
 Taiwan
-
 Tajikistan
-
 Tanzania
-
 Thailand
-
 Trinidad and Tobago
-
 Tunisia
-
 Turkey
-
 UAE
UAE
-
 Uganda
-
 Ukraine
-
 United Kingdom
-
United States
-
 Uruguay
-
 Uzbekistan
-
 Venezuela
-
 Vietnam
-
 Yemen
Yemen
-
 Zambia
-
 Zimbabwe
- Forex
- Crypto
