
Hedera weekly outlook: gains 1.94% as bearish momentum holds below key moving averages

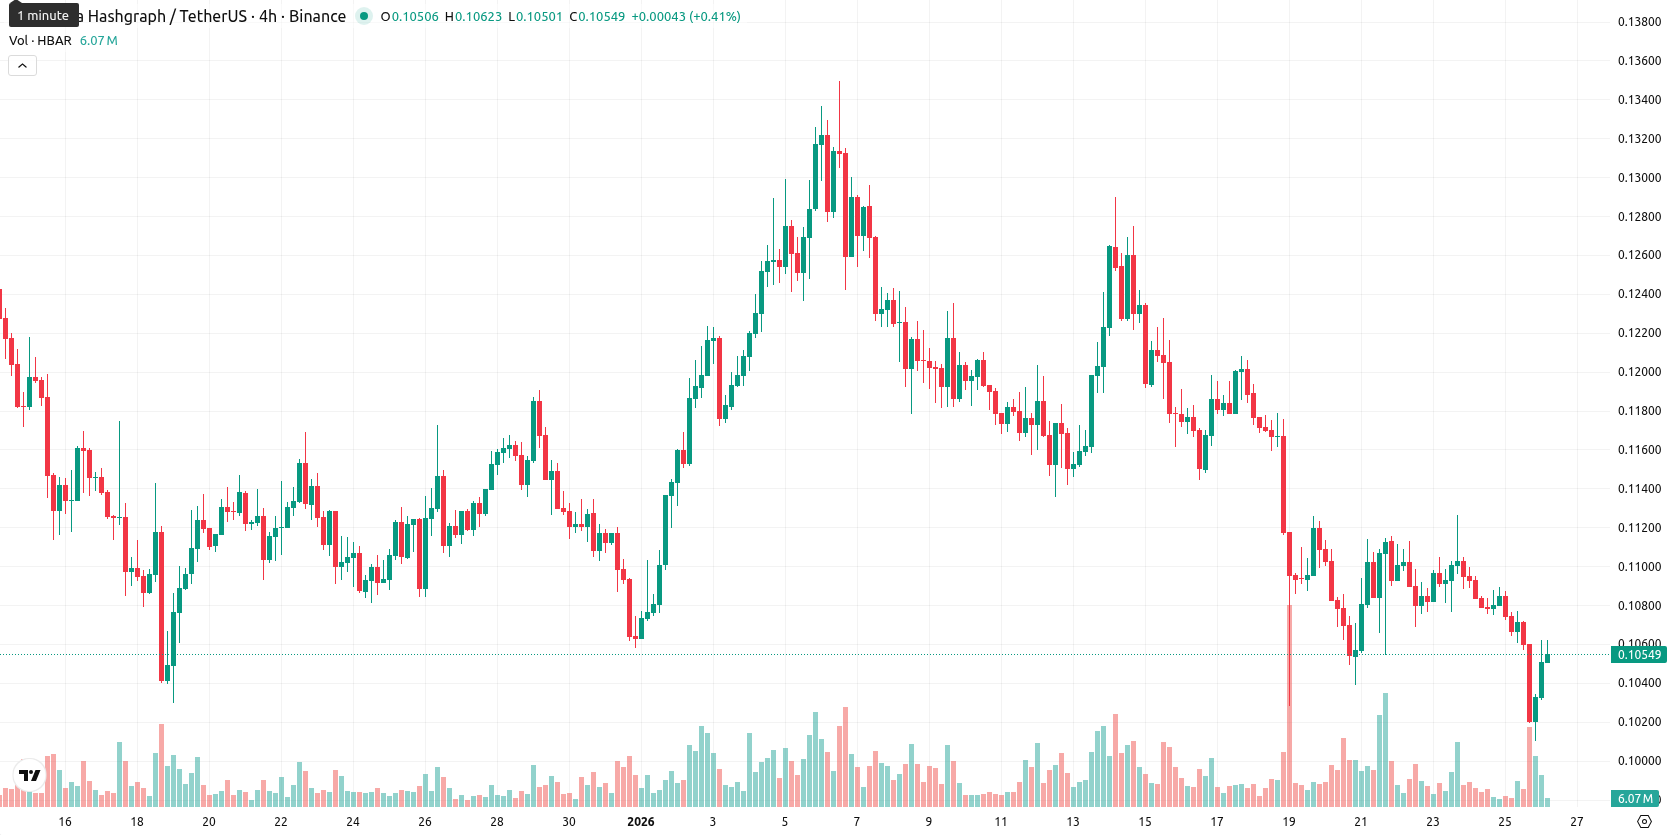
Hedera (HBAR) is currently trading at $0.1054, showing a modest weekly gain of 1.94% as price action holds near the mid-point of its recent $0.1010 – $0.1126 range. The asset remains decisively below the MA-20 ($0.1592), MA-50 ($0.1847), and MA-200 ($0.1126) on the weekly chart, highlighting persistent bearish momentum across all key moving averages.
Highlights
- HBAR trades at $0.1054, well below MA-20 ($0.1592), MA-50 ($0.1847), and MA-200 ($0.1126), confirming sustained bearish momentum across all timeframes.
- Oversold indicators—RSI (33.26), Stoch RSI (0.00), and CCI (–101.02)—suggest potential for a technical bounce, but sellers remain dominant as reflected in a negative BBP.
- For the next five trading days, HBAR is expected to consolidate between $0.1030 and $0.1169, with less than 20% probability of a meaningful price rally.
Enterprise partnerships and ETF listing drive positive sentiment this week
Hedera advanced its enterprise outreach by becoming the Official Partner of McLaren Racing, providing blockchain support for digital collectibles and fan engagement in motorsports. Institutional developments included the Canary HBAR ETF trading on Nasdaq and adoption of tokenized operations via Archax, strengthening links with traditional finance. Additional enhancements such as upgrades for interoperability with multiple chains and the expansion of real-world crypto payments through BlockBolt also highlighted HBAR’s growing ecosystem.
Bearish momentum persists as oversold signals hint at exhaustion
Weekly technical indicators show persistent downside pressure, with HBAR trading below all major moving averages and encountering dynamic resistance at the Kijun level of $0.1825. The MACD and ADX (22.67) reinforce a bearish bias, while oversold readings from the RSI (33.26), Stoch RSI (0.00), and CCI (–101.02) point to possible short-term exhaustion among sellers. The Awesome Oscillator holds neutral, and the negative BBP highlights continued dominance of selling, although volatility remains moderate within the current range.
Consolidation likely as oversold readings limit breakout prospects
Over the next five to seven trading days, HBAR is expected to consolidate between $0.1030 and $0.1169, with persistent oversold conditions counterbalancing ongoing selling pressure. A bullish breakout above $0.1126 is unlikely without renewed buying interest and stronger momentum signals. The prevailing scenario favors continued consolidation or mild downside, while a sharper decline below $0.1030 is possible only if market sentiment deteriorates further.
Previously it was reported that Hedera is trading near long-term support just above its weekly MA-200, while remaining below key short- and medium-term moving averages and exhibiting persistent bearish momentum. Technical indicators, including weak MACD, low RSI, and oversold oscillators, signal limited upside as the asset is expected to consolidate within a narrow range, with downside risk prevailing in the near term.


-
 Afghanistan
-
 Albania
-
 Algeria
-
 Angola
-
 Argentina
-
 Armenia
-
 Australia
-
 Austria
-
 Azerbaijan
-
 Bahamas
-
 Bahrain
-
 Bangladesh
-
 Belarus
-
 Belgium
-
 Bolivia
-
 Botswana
-
 Brazil
-
 Brunei
-
 Bulgaria
-
 Cambodia
-
 Cameroon
-
 Canada
-
 Chile
Chile
-
 China
China
-
 Colombia
-
 Congo
Congo
-
 Costa Rica
-
 Cote d'Ivoire
-
 Croatia
-
 Cuba
Cuba
-
 Cyprus
-
 Czechia
-
 DR Congo
-
 Denmark
-
 Dominican Republic
-
 Ecuador
-
 Egypt
Egypt
-
 El Salvador
-
 Estonia
-
 Eswatini
-
 Ethiopia
-
 Finland
-
 France
-
 Georgia
-
 Germany
-
 Ghana
Ghana
-
 Greece
-
 Haiti
Haiti
-
 Hong Kong
-
 Hungary
-
 India
India
-
 Indonesia
-
 Iran, Islamic republic
-
 Iraq
Iraq
-
 Ireland
-
 Israel
-
 Italy
Italy
-
 Jamaica
-
 Japan
Japan
-
 Jordan
-
 Kazakhstan
-
 Kenya
Kenya
-
 Korea
Korea
-
 Kuwait
-
 Kyrgyzstan
-
 Laos
Laos
-
 Latvia
-
 Lebanon
-
 Lesotho
-
 Libya
Libya
-
 Lithuania
-
 Luxembourg
-
 Madagascar
-
 Malaysia
-
 Malta
Malta
-
 Mauritius
-
 Mexico
-
 Moldova
-
 Mongolia
-
 Montenegro
-
 Morocco
-
 Mozambique
-
 Myanmar
-
 Namibia
-
 Nepal
Nepal
-
 Netherlands
-
 New Zealand
-
 Nigeria
-
 North Macedonia
-
 Norway
-
 Oman
Oman
-
 Pakistan
-
 Palestine
-
 Panama
-
 Papua New Guinea
-
 Paraguay
-
 Peru
Peru
-
 Philippines
-
 Poland
-
 Portugal
-
 Puerto Rico
-
 Qatar
Qatar
-
 Reunion
-
 Romania
-
 Rwanda
-
 Saudi Arabia
-
 Serbia
-
 Singapore
-
 Slovakia
-
 Slovenia
-
 Somalia
-
 South Africa
-
 Spain
Spain
-
 Sri Lanka
-
 Sweden
-
 Switzerland
-
 Syria
Syria
-
 Taiwan
-
 Tajikistan
-
 Tanzania
-
 Thailand
-
 Trinidad and Tobago
-
 Tunisia
-
 Turkey
-
 UAE
UAE
-
 Uganda
-
 Ukraine
-
 United Kingdom
-
United States
-
 Uruguay
-
 Uzbekistan
-
 Venezuela
-
 Vietnam
-
 Yemen
Yemen
-
 Zambia
-
 Zimbabwe
- Forex
- Crypto
