
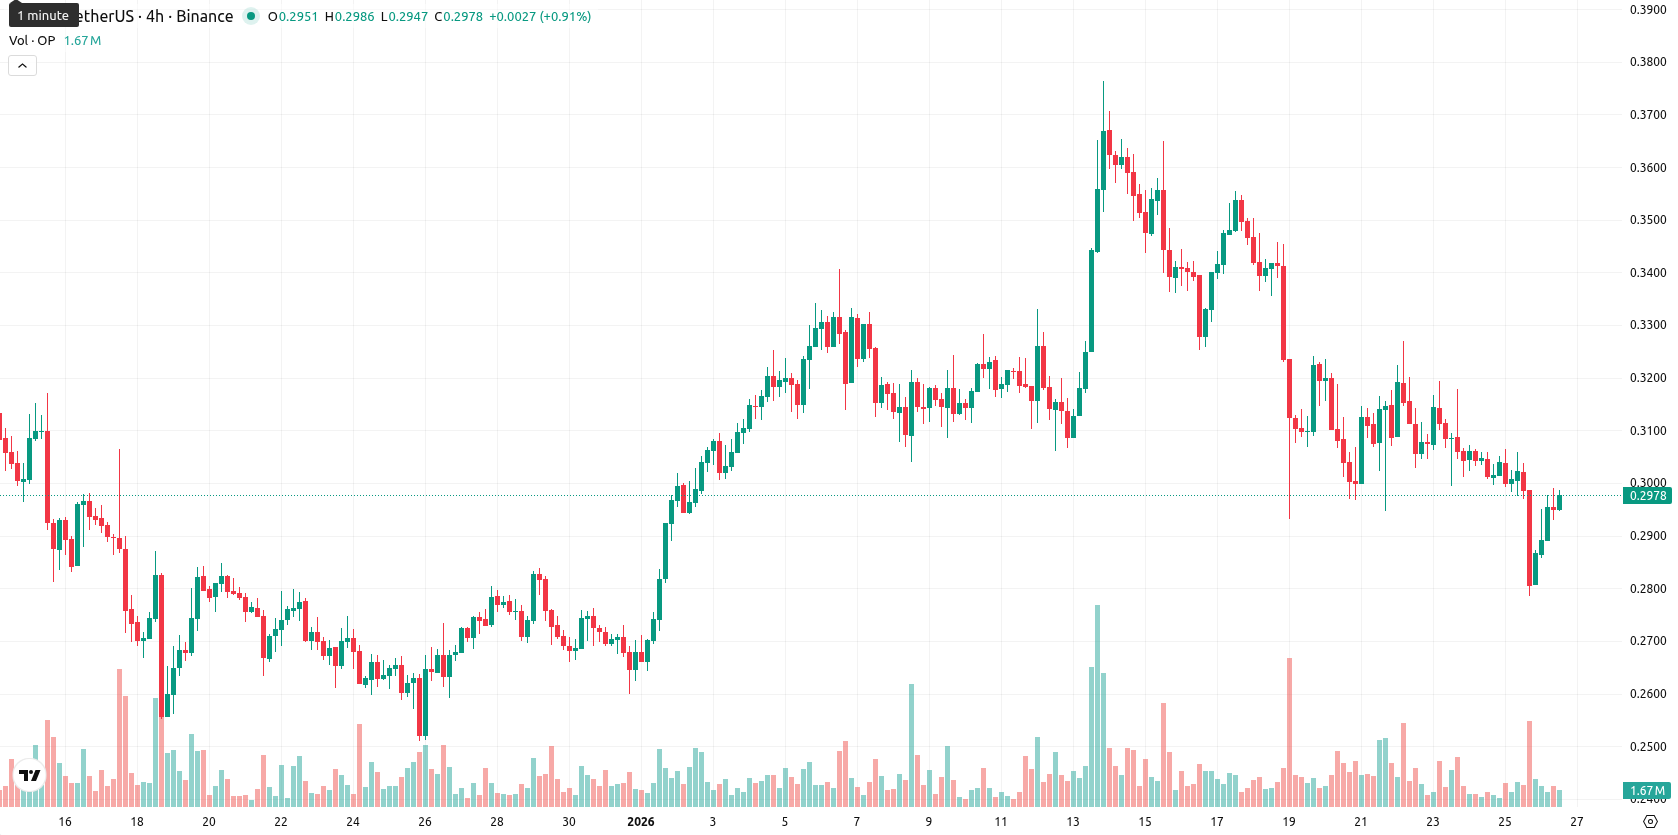
Optimism weekly report: gains 3.84% — trades between $0.29 and $0.32 as resistance holds

Optimism (OP) ended the week with further losses, moving lower within the past seven days. The asset remains below its MA-20 ($0.3210), MA-50 ($0.3028), and MA-200 ($0.5238) on the weekly chart, underscoring sustained downward momentum across all major timeframes.
Highlights
- OP is trading below the MA-20 ($0.3210), MA-50 ($0.3028), and MA-200 ($0.5238), confirming persistent downward pressure across all timeframes.
- Daily chart momentum indicators such as RSI, Commodity Channel Index, and Stochastic RSI are in oversold territory, but sellers remain firmly in control with low reversal signals.
- Expected five-day price range is $0.285–$0.340, with probability of a price increase under 20% and downside risk heightened if $0.285 support fails.
Bearish sentiment entrenched as oversold signals fail to prompt reversal
On the weekly timeframe, OP is firmly below all key moving averages, with the MA-20, MA-50, and MA-200 situated above current price action, indicating entrenched bearish sentiment. The Ichimoku Kijun around $0.3182 acts as dynamic resistance, and no significant support levels are present near the current price. Weekly RSI and CCI both remain in oversold territory, while the Stochastic RSI is also oversold, reflecting technical exhaustion but not confirming a reversal. Sellers continue to dominate, with momentum indicators and oscillators consistently displaying negative readings.
Sideways move expected as bearish exhaustion tempers further downside risk
Over the next 5–7 trading days, OP is expected to trade mostly sideways between $0.29 and $0.32 as the bearish trend shows potential signs of exhaustion, though downside risks persist. A breakout and consolidation above $0.32 could open the way to $0.34, but the probability of a sustained rally remains below 20%. Sustained weakness below $0.285 may trigger an accelerated decline. The overall outlook leans bearish, with a low probability of a strong upside reversal in the coming week.
Last time, analysts noted that Optimism (OP) is trading below all major moving averages with persistent downside risk, as technical indicators including RSI, CCI, and short-term MACD point to pronounced momentum weakness and oversold conditions. Near-term movement is expected to remain range-bound with limited rebound potential, facing resistance at $0.3034–$0.3182 and increased pressure on a break below $0.2550.


Latest Optimism News


-
 Afghanistan
-
 Albania
-
 Algeria
-
 Angola
-
 Argentina
-
 Armenia
-
 Australia
-
 Austria
-
 Azerbaijan
-
 Bahamas
-
 Bahrain
-
 Bangladesh
-
 Belarus
-
 Belgium
-
 Bolivia
-
 Botswana
-
 Brazil
-
 Brunei
-
 Bulgaria
-
 Cambodia
-
 Cameroon
-
 Canada
-
 Chile
Chile
-
 China
China
-
 Colombia
-
 Congo
Congo
-
 Costa Rica
-
 Cote d'Ivoire
-
 Croatia
-
 Cuba
Cuba
-
 Cyprus
-
 Czechia
-
 DR Congo
-
 Denmark
-
 Dominican Republic
-
 Ecuador
-
 Egypt
Egypt
-
 El Salvador
-
 Estonia
-
 Eswatini
-
 Ethiopia
-
 Finland
-
 France
-
 Georgia
-
 Germany
-
 Ghana
Ghana
-
 Greece
-
 Haiti
Haiti
-
 Hong Kong
-
 Hungary
-
 India
India
-
 Indonesia
-
 Iran, Islamic republic
-
 Iraq
Iraq
-
 Ireland
-
 Israel
-
 Italy
Italy
-
 Jamaica
-
 Japan
Japan
-
 Jordan
-
 Kazakhstan
-
 Kenya
Kenya
-
 Korea
Korea
-
 Kuwait
-
 Kyrgyzstan
-
 Laos
Laos
-
 Latvia
-
 Lebanon
-
 Lesotho
-
 Libya
Libya
-
 Lithuania
-
 Luxembourg
-
 Madagascar
-
 Malaysia
-
 Malta
Malta
-
 Mauritius
-
 Mexico
-
 Moldova
-
 Mongolia
-
 Montenegro
-
 Morocco
-
 Mozambique
-
 Myanmar
-
 Namibia
-
 Nepal
Nepal
-
 Netherlands
-
 New Zealand
-
 Nigeria
-
 North Macedonia
-
 Norway
-
 Oman
Oman
-
 Pakistan
-
 Palestine
-
 Panama
-
 Papua New Guinea
-
 Paraguay
-
 Peru
Peru
-
 Philippines
-
 Poland
-
 Portugal
-
 Puerto Rico
-
 Qatar
Qatar
-
 Reunion
-
 Romania
-
 Rwanda
-
 Saudi Arabia
-
 Serbia
-
 Singapore
-
 Slovakia
-
 Slovenia
-
 Somalia
-
 South Africa
-
 Spain
Spain
-
 Sri Lanka
-
 Sweden
-
 Switzerland
-
 Syria
Syria
-
 Taiwan
-
 Tajikistan
-
 Tanzania
-
 Thailand
-
 Trinidad and Tobago
-
 Tunisia
-
 Turkey
-
 UAE
UAE
-
 Uganda
-
 Ukraine
-
 United Kingdom
-
United States
-
 Uruguay
-
 Uzbekistan
-
 Venezuela
-
 Vietnam
-
 Yemen
Yemen
-
 Zambia
-
 Zimbabwe
- Forex
- Crypto
