
-7.32% for Optimism — bearish momentum persists below major moving averages

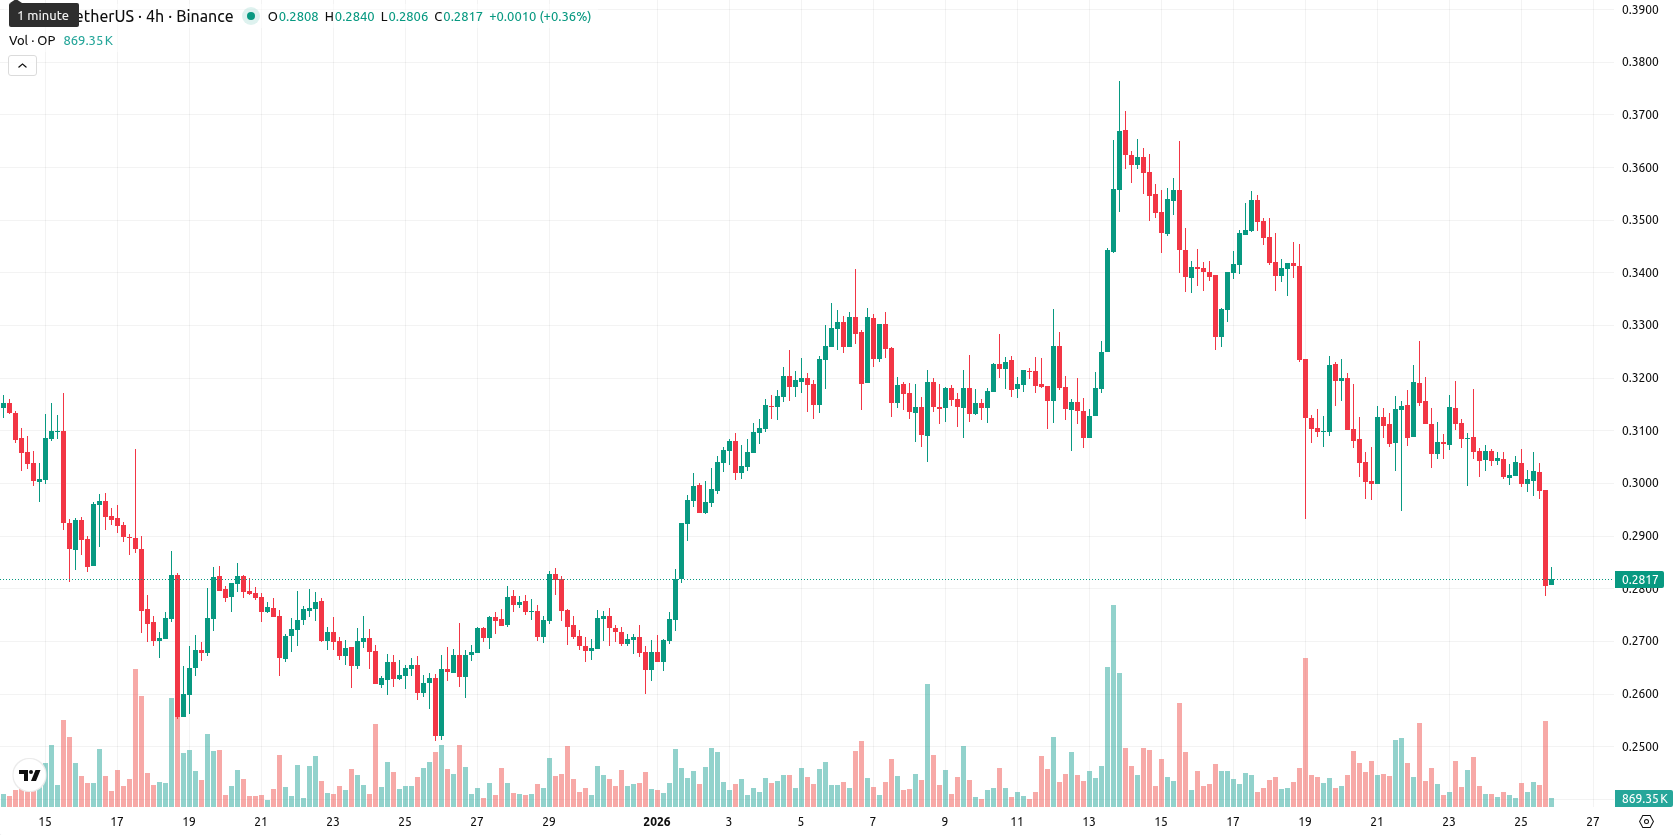
Optimism (OP) is trading at $0.2812 after a sharp session drop of 7.32%. The asset is currently below its MA-20 ($0.3232), MA-50 ($0.3034), and MA-200 ($0.5253), underscoring a bearish formation on all major timeframes.
Highlights
- OP is trading at $0.2812, decisively below MA-20 ($0.3232), MA-50 ($0.3034), and MA-200 ($0.5253), confirming bearish trends across all timeframes.
- Intraday momentum signals remain negative with strong selling pressure as the session dropped 7.32% to near the daily low of $0.2786 amid high volatility.
- Expected price range for the coming week is $0.2550 to $0.2900, with probability of a price increase under 20% and resistance at $0.3034–$0.3182.
Persistent downside risk as indicators flag momentum weakness
All trend-following indicators continue to flag downside risk: OP is positioned below all major moving averages. There is no clear dynamic support, while near-term resistance stands at the Ichimoku Kijun ($0.3182) and MA-50 ($0.3034). Intraday momentum indicators confirm pronounced weakness: MACD remains neutral on the daily but is strongly bearish in shorter timeframes, and ADX is subdued at 18.42, reflecting a lack of trend conviction. Multiple oscillators (RSI at 45.83, Stochastic RSI at 6.35, CCI at –99.89) point to persistent oversold conditions, while Bull/Bear Power indicates ongoing intraday selling pressure.
Limited rebound prospects as downside risk dominates short-term range
In the near term, OP is expected to trade within a $0.2550 – $0.2900 volatility band relative to current levels. The likelihood of a substantial rebound remains low, with downside risk outweighing bullish potential. A break below $0.2550 would increase pressure and could see further losses, while any recovery attempts face stiff resistance at $0.3034 – $0.3182. The baseline scenario involves continued range-bound movement in this corridor.
Previously it was reported that Optimism (OP) remains under sustained bearish pressure, with the price trading well below key weekly moving averages and resistance levels, while technical indicators such as RSI, CCI, and MACD confirm weak momentum and oversold conditions. Analysts note that a sideways range is likely in the near term, as persistent sell-side momentum and lackluster demand dampen prospects for a significant breakout or recovery.


-
 Afghanistan
-
 Albania
-
 Algeria
-
 Angola
-
 Argentina
-
 Armenia
-
 Australia
-
 Austria
-
 Azerbaijan
-
 Bahamas
-
 Bahrain
-
 Bangladesh
-
 Belarus
-
 Belgium
-
 Bolivia
-
 Botswana
-
 Brazil
-
 Brunei
-
 Bulgaria
-
 Cambodia
-
 Cameroon
-
 Canada
-
 Chile
Chile
-
 China
China
-
 Colombia
-
 Congo
Congo
-
 Costa Rica
-
 Cote d'Ivoire
-
 Croatia
-
 Cuba
Cuba
-
 Cyprus
-
 Czechia
-
 DR Congo
-
 Denmark
-
 Dominican Republic
-
 Ecuador
-
 Egypt
Egypt
-
 El Salvador
-
 Estonia
-
 Eswatini
-
 Ethiopia
-
 Finland
-
 France
-
 Georgia
-
 Germany
-
 Ghana
Ghana
-
 Greece
-
 Haiti
Haiti
-
 Hong Kong
-
 Hungary
-
 India
India
-
 Indonesia
-
 Iran, Islamic republic
-
 Iraq
Iraq
-
 Ireland
-
 Israel
-
 Italy
Italy
-
 Jamaica
-
 Japan
Japan
-
 Jordan
-
 Kazakhstan
-
 Kenya
Kenya
-
 Korea
Korea
-
 Kuwait
-
 Kyrgyzstan
-
 Laos
Laos
-
 Latvia
-
 Lebanon
-
 Lesotho
-
 Libya
Libya
-
 Lithuania
-
 Luxembourg
-
 Madagascar
-
 Malaysia
-
 Malta
Malta
-
 Mauritius
-
 Mexico
-
 Moldova
-
 Mongolia
-
 Montenegro
-
 Morocco
-
 Mozambique
-
 Myanmar
-
 Namibia
-
 Nepal
Nepal
-
 Netherlands
-
 New Zealand
-
 Nigeria
-
 North Macedonia
-
 Norway
-
 Oman
Oman
-
 Pakistan
-
 Palestine
-
 Panama
-
 Papua New Guinea
-
 Paraguay
-
 Peru
Peru
-
 Philippines
-
 Poland
-
 Portugal
-
 Puerto Rico
-
 Qatar
Qatar
-
 Reunion
-
 Romania
-
 Rwanda
-
 Saudi Arabia
-
 Serbia
-
 Singapore
-
 Slovakia
-
 Slovenia
-
 Somalia
-
 South Africa
-
 Spain
Spain
-
 Sri Lanka
-
 Sweden
-
 Switzerland
-
 Syria
Syria
-
 Taiwan
-
 Tajikistan
-
 Tanzania
-
 Thailand
-
 Trinidad and Tobago
-
 Tunisia
-
 Turkey
-
 UAE
UAE
-
 Uganda
-
 Ukraine
-
 United Kingdom
-
United States
-
 Uruguay
-
 Uzbekistan
-
 Venezuela
-
 Vietnam
-
 Yemen
Yemen
-
 Zambia
-
 Zimbabwe
- Forex
- Crypto
