
Optimism trends downward, facing bearish tilt within current volatility range: weekly review

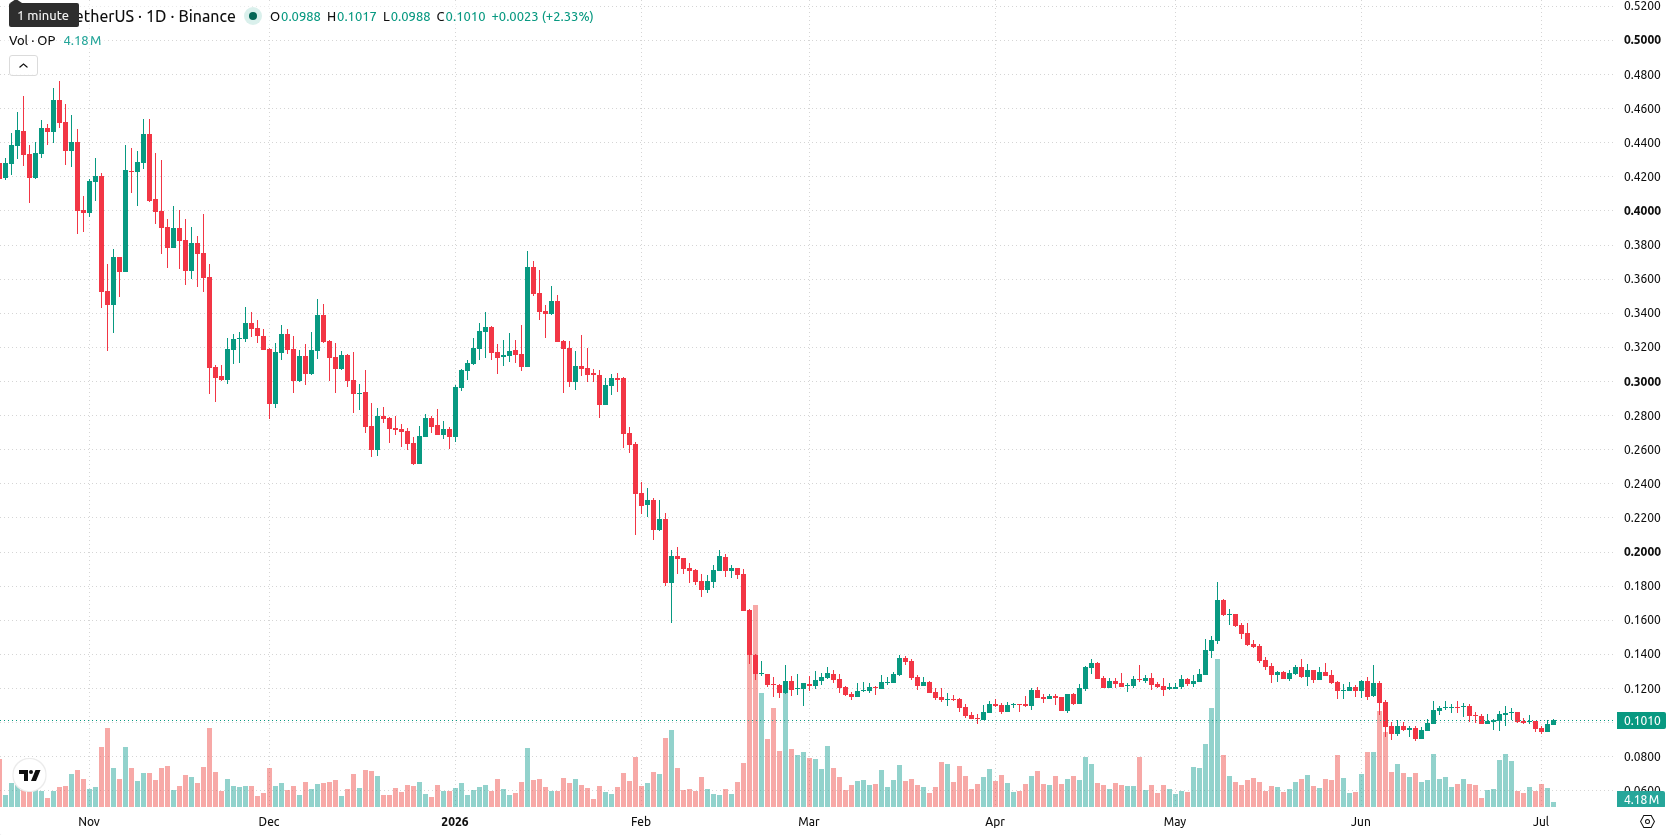
Optimism (OP) is currently priced at $0.0987, having declined $0.0083 or 5.61% over the past week. The asset is trading below both the MA-20 ($0.1166) and MA-50 ($0.3336) on the weekly chart, indicating persistent downside pressure and a bearish trend.
Highlights
- OP maintains a strong bearish trend, consistently trading below primary moving averages with persistent downside pressure.
- Bearish momentum dominates as multiple indicators confirm oversold conditions and sellers remain in control.
- OP is likely to trade in a $0.0885 to $0.1090 range over the coming week, with low probability of meaningful recovery.
Ongoing seller control as momentum and oscillators deteriorate over the week
Weekly technical indicators reinforce the negative outlook: OP remains below key moving averages, with the MA-20 acting as the nearest dynamic resistance. Momentum signals on the W1 chart — including MACD (Strong Sell), ADX (Sell), and negative Bull/Bear Power — highlight ongoing seller dominance. The RSI has edged down to 32.85, near oversold levels, while CCI also signals oversold conditions. Stochastic RSI is neutral at 50. Weekly price action is contained within a volatile, but non-reversing, mid-range.
Sideways-to-bearish outlook expected as reversal signals remain absent next week
For the next 7 days, OP is expected to fluctuate between $0.0885 and $0.1090, based on current volatility and technical levels. Baseline scenario calls for sideways price action around $0.0987 with a strong bearish tilt, as none of the four main momentum indicators signal a reversal. A break above $0.1090 could trigger a corrective bounce, but this is unlikely given prevailing conditions. Should support in the mid-$0.09 zone fail, further declines toward $0.0885 or lower are possible.
Earlier, analysts noted that persistent bearish momentum and seller dominance were expected to keep Optimism under pressure. Latest developments confirm this defensive posture, with traders now advised to closely monitor the $0.0885 support zone for signs of further downside risk in the coming week.


Latest Optimism News


-
 Afghanistan
-
 Albania
-
 Algeria
-
 Angola
-
 Argentina
-
 Armenia
-
 Australia
-
 Austria
-
 Azerbaijan
-
 Bahamas
-
 Bahrain
-
 Bangladesh
-
 Belarus
-
 Belgium
-
 Bolivia
-
 Botswana
-
 Brazil
-
 Brunei
-
 Bulgaria
-
 Cambodia
-
 Cameroon
-
 Canada
-
 Chile
Chile
-
 China
China
-
 Colombia
-
 Congo
Congo
-
 Costa Rica
-
 Cote d'Ivoire
-
 Croatia
-
 Cuba
Cuba
-
 Cyprus
-
 Czechia
-
 DR Congo
-
 Denmark
-
 Dominican Republic
-
 Ecuador
-
 Egypt
Egypt
-
 El Salvador
-
 Estonia
-
 Eswatini
-
 Ethiopia
-
 Finland
-
 France
-
 Georgia
-
 Germany
-
 Ghana
Ghana
-
 Greece
-
 Haiti
Haiti
-
 Hong Kong
-
 Hungary
-
 India
India
-
 Indonesia
-
 Iran, Islamic republic
-
 Iraq
Iraq
-
 Ireland
-
 Israel
-
 Italy
Italy
-
 Jamaica
-
 Japan
Japan
-
 Jordan
-
 Kazakhstan
-
 Kenya
Kenya
-
 Korea
Korea
-
 Kuwait
-
 Kyrgyzstan
-
 Laos
Laos
-
 Latvia
-
 Lebanon
-
 Lesotho
-
 Libya
Libya
-
 Lithuania
-
 Luxembourg
-
 Madagascar
-
 Malaysia
-
 Malta
Malta
-
 Mauritius
-
 Mexico
-
 Moldova
-
 Mongolia
-
 Montenegro
-
 Morocco
-
 Mozambique
-
 Myanmar
-
 Namibia
-
 Nepal
Nepal
-
 Netherlands
-
 New Zealand
-
 Nigeria
-
 North Macedonia
-
 Norway
-
 Oman
Oman
-
 Pakistan
-
 Palestine
-
 Panama
-
 Papua New Guinea
-
 Paraguay
-
 Peru
Peru
-
 Philippines
-
 Poland
-
 Portugal
-
 Puerto Rico
-
 Qatar
Qatar
-
 Reunion
-
 Romania
-
 Rwanda
-
 Saudi Arabia
-
 Serbia
-
 Singapore
-
 Slovakia
-
 Slovenia
-
 Somalia
-
 South Africa
-
 Spain
Spain
-
 Sri Lanka
-
 Sweden
-
 Switzerland
-
 Syria
Syria
-
 Taiwan
-
 Tajikistan
-
 Tanzania
-
 Thailand
-
 Trinidad and Tobago
-
 Tunisia
-
 Turkey
-
 UAE
UAE
-
 Uganda
-
 Ukraine
-
 United Kingdom
-
United States
-
 Uruguay
-
 Uzbekistan
-
 Venezuela
-
 Vietnam
-
 Yemen
Yemen
-
 Zambia
-
 Zimbabwe
- Forex
- Crypto
