
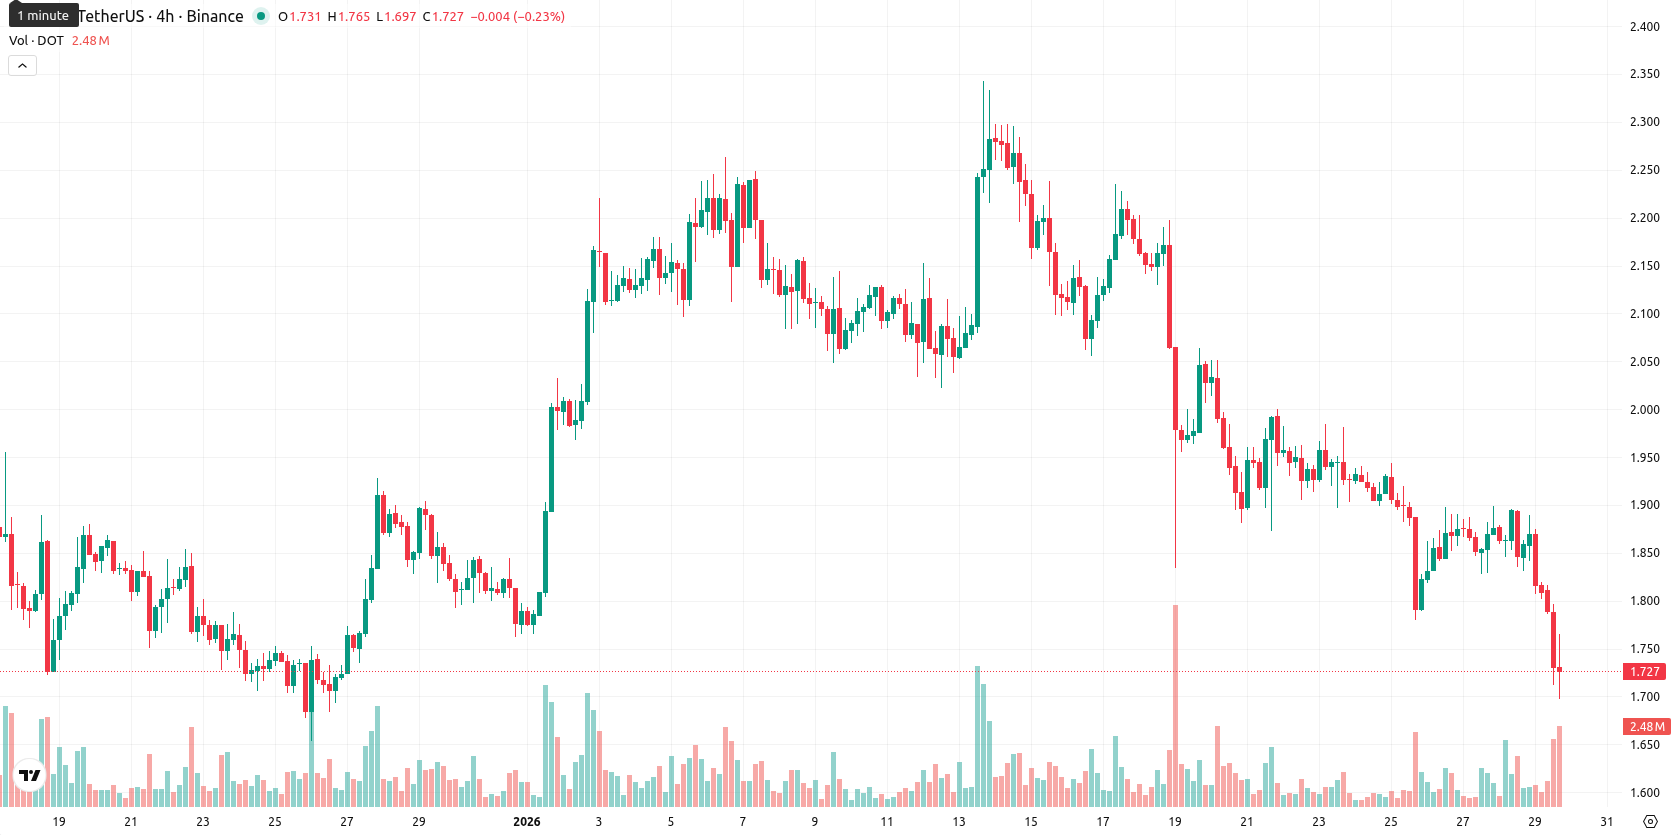
Polkadot price prediction: Will technical weakness worsen? DOT falls 7.7% to $1.70

Polkadot (DOT) is trading well below the MA-20 ($2.019), MA-50 ($1.970), and MA-200 ($3.125), confirming persistent bearish momentum across all major timeframes. The current session has seen DOT decline 7.69% after opening nearly flat, now trading near today’s low as price action remains pressured and below major averages.
Highlights
- Polkadot reported its first quarterly profit since public disclosures began, posting a $4.1 million gain in Q4 2025 driven by reduced spending and asset diversification.
- Gavin Wood’s return as CEO of Parity Technologies has renewed focus on core development and treasury management, while network upgrades improve transaction speeds for native applications.
- DOT trades well below MA-20, MA-50, and MA-200, with high probability (>80%) of maintaining a bearish range between $1.65 and $1.90 amid persistent negative momentum.
Quarterly profit and leadership change drive renewed investor focus
Polkadot has reported its first quarterly profit since public financial disclosures began, with a $4.1 million gain for the fourth quarter of 2025 due to reduced spending and asset diversification. This improvement is partly driven by Gavin Wood’s return as CEO of Parity Technologies, bringing renewed focus to essential development and treasury management. Ongoing network upgrades have also enhanced transaction speeds and supported Polkadot-native applications.
Momentum fades as bearish signals and volatility intensify
Momentum signals remain weak, with both MACD and ADX on the daily chart showing a clear loss of buying interest and subdued trend strength. Oscillators indicate that DOT is approaching oversold territory: RSI stands at 40, Stochastic RSI is deeply oversold at 13, and CCI confirms selling pressure at –97. Bull/Bear Power remains negative, underscoring continued dominance by sellers, while the Awesome Oscillator also signals ongoing bearish conditions. The nearest dynamic resistance is the Ichimoku Kijun at $2.062, with no immediate upward support evident from major averages. Intraday volatility is high, with price pressured steadily lower since the open, reinforcing the negative momentum signaled by technical indicators.
Downside risk dominates as bearish momentum sets volatility range
Looking ahead to the next five trading days, the expected price range for DOT is adjusted to $1.65 – $1.90 to reflect typical volatility relative to current levels. The probability of further declines is very high (more than 80%), while a sustainable rebound appears unlikely at this stage. A baseline scenario keeps DOT trading sideways within this volatility band, with renewed bearish momentum possible if the price breaks below $1.65. A bullish reversal would require a move above the Kijun resistance at $2.06, which current indicators do not support.
Previously it was reported that Polkadot remains under persistent selling pressure, trading well below key moving averages and exhibiting sustained bearish momentum as indicated by negative MACD and low RSI values. Near-term price action is expected to stay volatile within a defined range, with further downside risk prevailing absent any bullish reversal signals.


Latest Polkadot News


-
 Afghanistan
-
 Albania
-
 Algeria
-
 Angola
-
 Argentina
-
 Armenia
-
 Australia
-
 Austria
-
 Azerbaijan
-
 Bahamas
-
 Bahrain
-
 Bangladesh
-
 Belarus
-
 Belgium
-
 Bolivia
-
 Botswana
-
 Brazil
-
 Brunei
-
 Bulgaria
-
 Cambodia
-
 Cameroon
-
 Canada
-
 Chile
Chile
-
 China
China
-
 Colombia
-
 Congo
Congo
-
 Costa Rica
-
 Cote d'Ivoire
-
 Croatia
-
 Cuba
Cuba
-
 Cyprus
-
 Czechia
-
 DR Congo
-
 Denmark
-
 Dominican Republic
-
 Ecuador
-
 Egypt
Egypt
-
 El Salvador
-
 Estonia
-
 Eswatini
-
 Ethiopia
-
 Finland
-
 France
-
 Georgia
-
 Germany
-
 Ghana
Ghana
-
 Greece
-
 Haiti
Haiti
-
 Hong Kong
-
 Hungary
-
 India
India
-
 Indonesia
-
 Iran, Islamic republic
-
 Iraq
Iraq
-
 Ireland
-
 Israel
-
 Italy
Italy
-
 Jamaica
-
 Japan
Japan
-
 Jordan
-
 Kazakhstan
-
 Kenya
Kenya
-
 Korea
Korea
-
 Kuwait
-
 Kyrgyzstan
-
 Laos
Laos
-
 Latvia
-
 Lebanon
-
 Lesotho
-
 Libya
Libya
-
 Lithuania
-
 Luxembourg
-
 Madagascar
-
 Malaysia
-
 Malta
Malta
-
 Mauritius
-
 Mexico
-
 Moldova
-
 Mongolia
-
 Montenegro
-
 Morocco
-
 Mozambique
-
 Myanmar
-
 Namibia
-
 Nepal
Nepal
-
 Netherlands
-
 New Zealand
-
 Nigeria
-
 North Macedonia
-
 Norway
-
 Oman
Oman
-
 Pakistan
-
 Palestine
-
 Panama
-
 Papua New Guinea
-
 Paraguay
-
 Peru
Peru
-
 Philippines
-
 Poland
-
 Portugal
-
 Puerto Rico
-
 Qatar
Qatar
-
 Reunion
-
 Romania
-
 Rwanda
-
 Saudi Arabia
-
 Serbia
-
 Singapore
-
 Slovakia
-
 Slovenia
-
 Somalia
-
 South Africa
-
 Spain
Spain
-
 Sri Lanka
-
 Sweden
-
 Switzerland
-
 Syria
Syria
-
 Taiwan
-
 Tajikistan
-
 Tanzania
-
 Thailand
-
 Trinidad and Tobago
-
 Tunisia
-
 Turkey
-
 UAE
UAE
-
 Uganda
-
 Ukraine
-
 United Kingdom
-
United States
-
 Uruguay
-
 Uzbekistan
-
 Venezuela
-
 Vietnam
-
 Yemen
Yemen
-
 Zambia
-
 Zimbabwe
- Forex
- Crypto
