
Pudgy Penguins drops 7.85% as sellers dominate and oversold signals mount

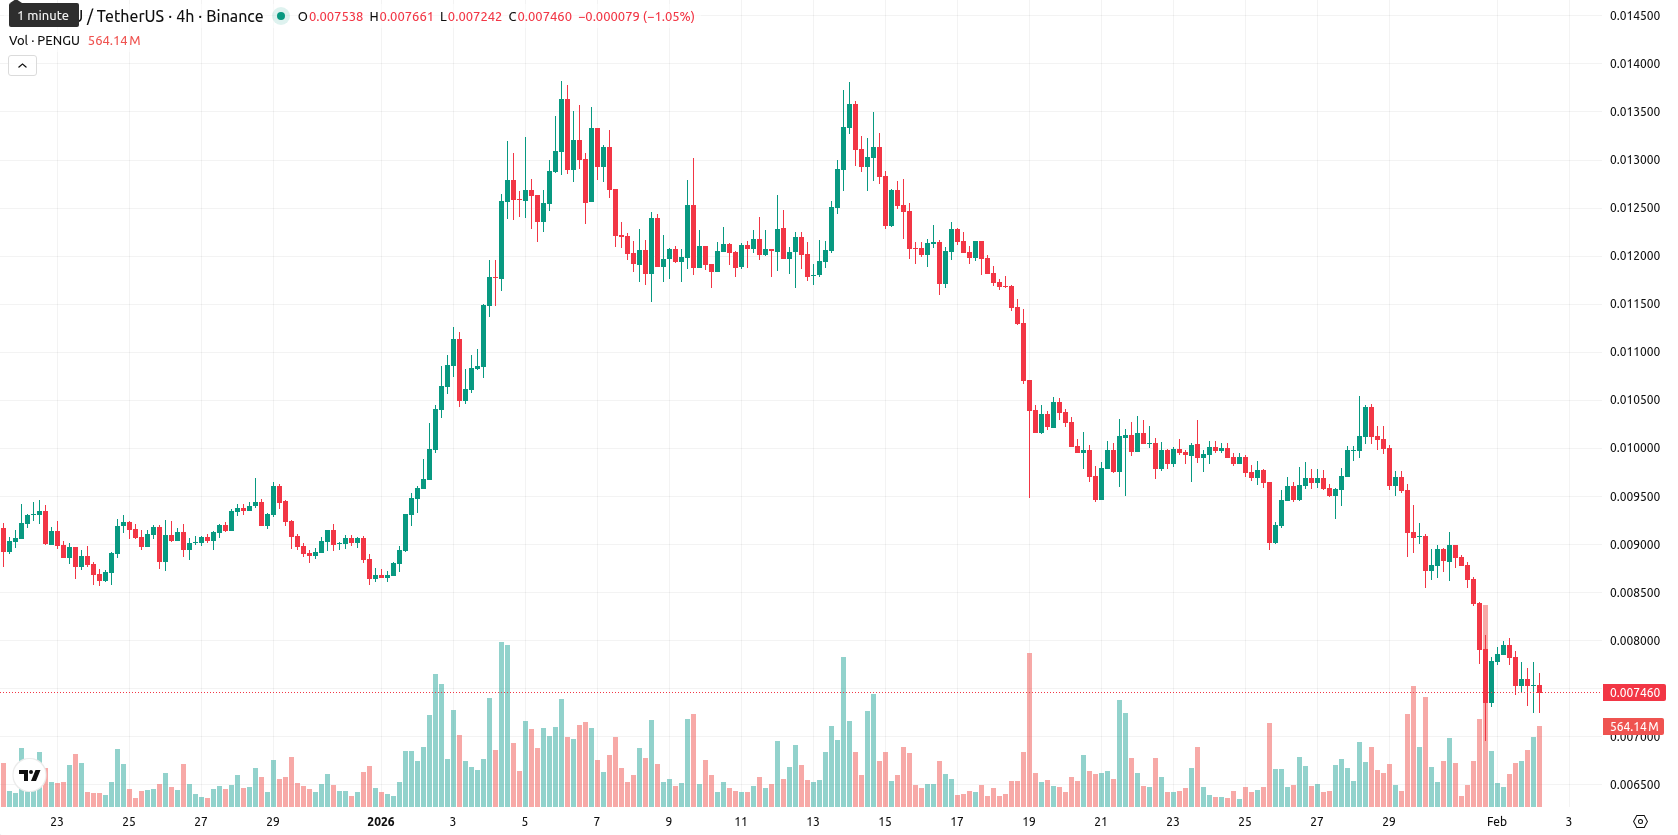
Pudgy Penguins (PENGU) is currently trading at $0.0073, well below the MA-20 ($0.01023), MA-50 ($0.01028), and MA-200 ($0.02189) levels, reinforcing persistent bearish pressure across short-, medium-, and long-term timeframes. The nearest dynamic support from the Ichimoku Kijun lies at $0.01038, now acting as immediate resistance, indicating that the price remains under a strong downward structure.
Highlights
- PENGU is trading at $0.0073, significantly below its MA-20 ($0.01023), MA-50 ($0.01028), and MA-200 ($0.02189), confirming a strong bearish trend across all timeframes.
- Momentum indicators (MACD, ADX, RSI at 30.41, Stochastic RSI oversold, CCI at –150) reinforce persistent downside pressure and high seller dominance.
- Key support is at $0.0066 and resistance at $0.0088; a breakdown below support risks further selling, while upside moves are unlikely without a breakout above $0.01038.
Oversold signals and high volatility reinforce downside conviction
Momentum signals remain firmly negative, as both the MACD and ADX on the daily and weekly timeframes confirm ongoing downside strength. The Relative Strength Index is near oversold territory at 30.41, the Stochastic RSI is completely oversold, and the Commodity Channel Index is deeply negative at –150, highlighting extended weakness. Bull/Bear Power shows a seller-dominated environment, while the Awesome Oscillator aligns with the prevailing bearish trend. The session opened slightly below the prior close without a notable gap, and the price has sharply retreated 7.85%, now trading close to the daily low ($0.00724), evidencing high volatility and sustained pressure after the open. There are no significant divergences among momentum indicators and oscillators, with all signals reinforcing the negative intraday tone.
Downtrend outlook intensifies as sell signals dominate short-term
Looking ahead, the expected price range for the next 5 trading days is adjusted to $0.0066 – $0.0088, keeping the current price at the midpoint and reflecting recent volatility and downtrend persistence. There is a very low probability (less than 20%) of a sustained price increase, while a further decline is much more likely based on the consistent "Sell" or "Strong Sell" forecasts across daily and weekly momentum indicators and moving averages. Baseline scenario: the price stabilizes within the $0.0066 – $0.0088 corridor as selling eases. Bullish scenario: a breakout above Ichimoku Kijun ($0.01038) and $0.0088 resistance would suggest a relief rally. Bearish scenario: breakdown below $0.0066 support could trigger another wave of selling pressure.
Last time, analysts noted that Pudgy Penguins remains under firm selling pressure, with the price trading well below all key moving averages across multiple timeframes, and all major momentum indicators (MACD, ADX, RSI, Stoch RSI, CCI) signaling sustained bearish momentum and oversold conditions. Immediate resistance is identified at the Ichimoku Kijun, while continued volatility and weak support near recent lows leave further downside as the most probable scenario in the short term.


Latest PENGU News


-
 Afghanistan
-
 Albania
-
 Algeria
-
 Angola
-
 Argentina
-
 Armenia
-
 Australia
-
 Austria
-
 Azerbaijan
-
 Bahamas
-
 Bahrain
-
 Bangladesh
-
 Belarus
-
 Belgium
-
 Bolivia
-
 Botswana
-
 Brazil
-
 Brunei
-
 Bulgaria
-
 Cambodia
-
 Cameroon
-
 Canada
-
 Chile
Chile
-
 China
China
-
 Colombia
-
 Congo
Congo
-
 Costa Rica
-
 Cote d'Ivoire
-
 Croatia
-
 Cuba
Cuba
-
 Cyprus
-
 Czechia
-
 DR Congo
-
 Denmark
-
 Dominican Republic
-
 Ecuador
-
 Egypt
Egypt
-
 El Salvador
-
 Estonia
-
 Eswatini
-
 Ethiopia
-
 Finland
-
 France
-
 Georgia
-
 Germany
-
 Ghana
Ghana
-
 Greece
-
 Haiti
Haiti
-
 Hong Kong
-
 Hungary
-
 India
India
-
 Indonesia
-
 Iran, Islamic republic
-
 Iraq
Iraq
-
 Ireland
-
 Israel
-
 Italy
Italy
-
 Jamaica
-
 Japan
Japan
-
 Jordan
-
 Kazakhstan
-
 Kenya
Kenya
-
 Korea
Korea
-
 Kuwait
-
 Kyrgyzstan
-
 Laos
Laos
-
 Latvia
-
 Lebanon
-
 Lesotho
-
 Libya
Libya
-
 Lithuania
-
 Luxembourg
-
 Madagascar
-
 Malaysia
-
 Malta
Malta
-
 Mauritius
-
 Mexico
-
 Moldova
-
 Mongolia
-
 Montenegro
-
 Morocco
-
 Mozambique
-
 Myanmar
-
 Namibia
-
 Nepal
Nepal
-
 Netherlands
-
 New Zealand
-
 Nigeria
-
 North Macedonia
-
 Norway
-
 Oman
Oman
-
 Pakistan
-
 Palestine
-
 Panama
-
 Papua New Guinea
-
 Paraguay
-
 Peru
Peru
-
 Philippines
-
 Poland
-
 Portugal
-
 Puerto Rico
-
 Qatar
Qatar
-
 Reunion
-
 Romania
-
 Rwanda
-
 Saudi Arabia
-
 Serbia
-
 Singapore
-
 Slovakia
-
 Slovenia
-
 Somalia
-
 South Africa
-
 Spain
Spain
-
 Sri Lanka
-
 Sweden
-
 Switzerland
-
 Syria
Syria
-
 Taiwan
-
 Tajikistan
-
 Tanzania
-
 Thailand
-
 Trinidad and Tobago
-
 Tunisia
-
 Turkey
-
 UAE
UAE
-
 Uganda
-
 Ukraine
-
 United Kingdom
-
United States
-
 Uruguay
-
 Uzbekistan
-
 Venezuela
-
 Vietnam
-
 Yemen
Yemen
-
 Zambia
-
 Zimbabwe
- Forex
- Crypto
