
Uniswap weekly report: consolidates near $3.93 — technicals signal ongoing bearish pressure

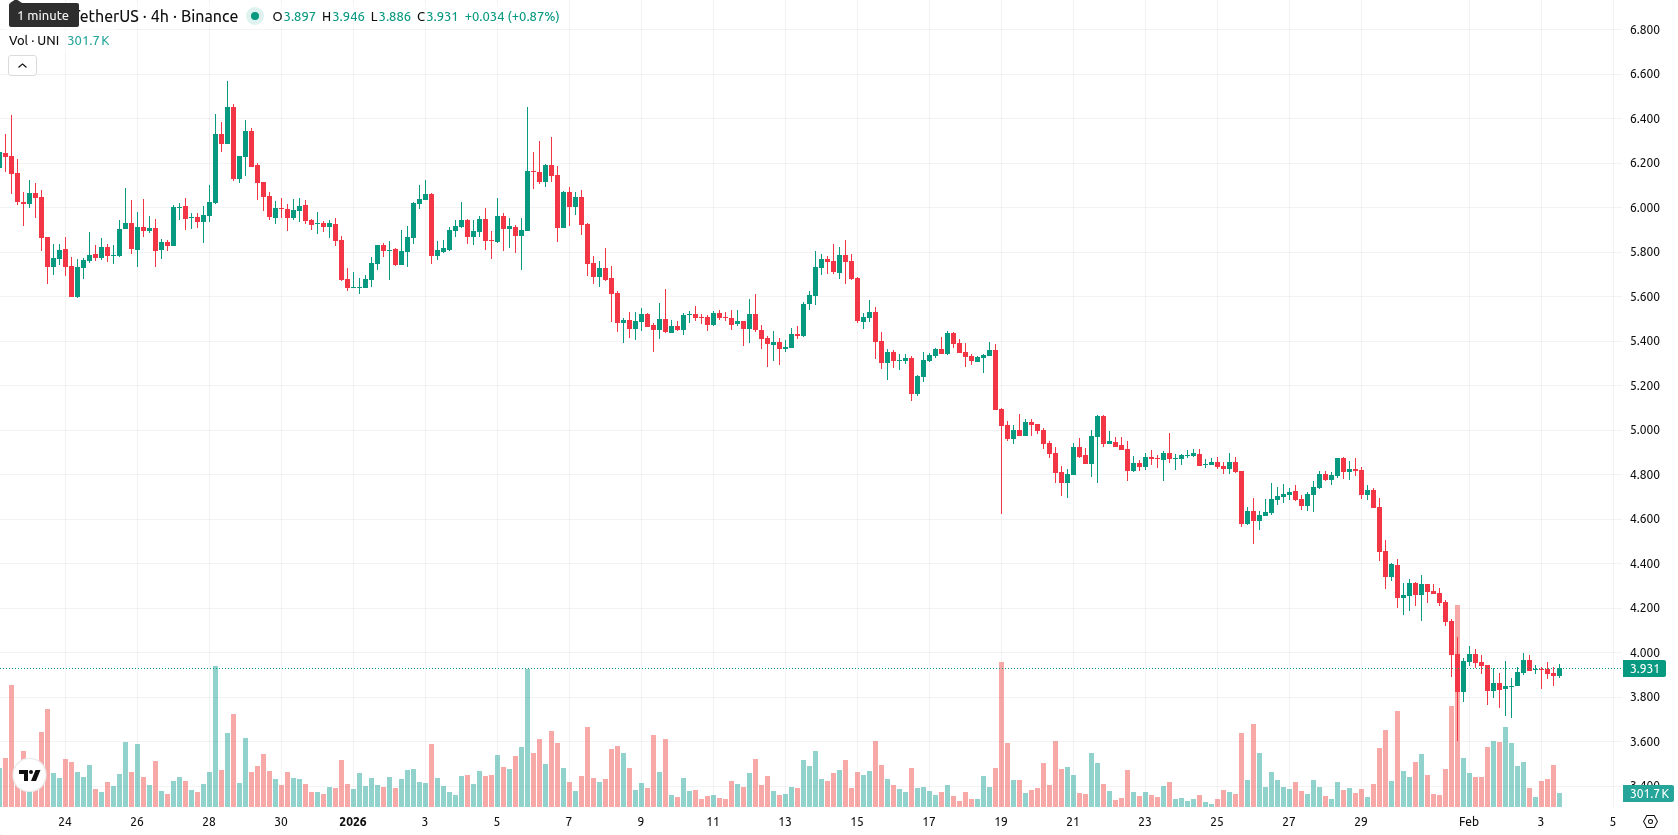
Uniswap (UNI) is trading at $3.933, which puts it below all major weekly moving averages: MA-20 at $4.7749, MA-50 at $5.3393, and MA-200 at $7.4435. Over the past week, UNI has continued to exhibit bearish pressure, keeping the price firmly below key averages and indicating ongoing weakness in both the short and longer-term trends.
Highlights
- UNI is trading at $3.933, below all major Moving Averages—MA-20 ($4.7749), MA-50 ($5.3393), and MA-200 ($7.4435)—signaling persistent bearish pressure across all timeframes.
- Momentum indicators remain weak with a negative MACD, low ADX, and oversold readings from RSI and CCI, despite a modest daily gain of 0.03%.
- Key resistance lies at $4.73–$4.77 while support is at $3.65, with a projected range of $3.65 to $3.97 and a breakout above resistance needed for a bullish reversal.
Oversold technicals persist as resistance strengthens above recent lows
Weekly technical signals present a bearish outlook. UNI remains below all relevant W1 moving averages, with dynamic support at the recent low and resistance at the Ichimoku Kijun ($4.7260), closely aligned with the MA-20 and MA-50, confirming a strong supply zone above. Weekly momentum readings, including RSI and the Commodity Channel Index, suggest oversold conditions, while oscillators such as Awesome Oscillator and negative Bull/Bear Power reinforce the prevailing downtrend.
Sideways consolidation expected amid limited breakout prospects this week
For the coming week, UNI is expected to trade within a narrow band between $3.65 and $3.97. The baseline scenario points to sideways consolidation, with the probability of a sustained rally remaining low unless a close above the $4.73–$4.77 resistance is achieved. A weekly close below $3.65 would signal an acceleration of the downtrend, while technical reversal requires marked improvement in momentum and a breakout above resistance.
Previously it was reported that Uniswap (UNI) is experiencing strong bearish momentum, trading decisively below its key moving averages with all major oscillators, including RSI and MACD, signaling oversold conditions. The token faces elevated downside risk and volatility, lacking significant support above $3.60, with resistance near $4.35 and a low probability of near-term recovery unless a sustained move above resistance occurs.


Latest Uniswap (UNI) News


-
 Afghanistan
-
 Albania
-
 Algeria
-
 Angola
-
 Argentina
-
 Armenia
-
 Australia
-
 Austria
-
 Azerbaijan
-
 Bahamas
-
 Bahrain
-
 Bangladesh
-
 Belarus
-
 Belgium
-
 Bolivia
-
 Botswana
-
 Brazil
-
 Brunei
-
 Bulgaria
-
 Cambodia
-
 Cameroon
-
 Canada
-
 Chile
Chile
-
 China
China
-
 Colombia
-
 Congo
Congo
-
 Costa Rica
-
 Cote d'Ivoire
-
 Croatia
-
 Cuba
Cuba
-
 Cyprus
-
 Czechia
-
 DR Congo
-
 Denmark
-
 Dominican Republic
-
 Ecuador
-
 Egypt
Egypt
-
 El Salvador
-
 Estonia
-
 Eswatini
-
 Ethiopia
-
 Finland
-
 France
-
 Georgia
-
 Germany
-
 Ghana
Ghana
-
 Greece
-
 Haiti
Haiti
-
 Hong Kong
-
 Hungary
-
 India
India
-
 Indonesia
-
 Iran, Islamic republic
-
 Iraq
Iraq
-
 Ireland
-
 Israel
-
 Italy
Italy
-
 Jamaica
-
 Japan
Japan
-
 Jordan
-
 Kazakhstan
-
 Kenya
Kenya
-
 Korea
Korea
-
 Kuwait
-
 Kyrgyzstan
-
 Laos
Laos
-
 Latvia
-
 Lebanon
-
 Lesotho
-
 Libya
Libya
-
 Lithuania
-
 Luxembourg
-
 Madagascar
-
 Malaysia
-
 Malta
Malta
-
 Mauritius
-
 Mexico
-
 Moldova
-
 Mongolia
-
 Montenegro
-
 Morocco
-
 Mozambique
-
 Myanmar
-
 Namibia
-
 Nepal
Nepal
-
 Netherlands
-
 New Zealand
-
 Nigeria
-
 North Macedonia
-
 Norway
-
 Oman
Oman
-
 Pakistan
-
 Palestine
-
 Panama
-
 Papua New Guinea
-
 Paraguay
-
 Peru
Peru
-
 Philippines
-
 Poland
-
 Portugal
-
 Puerto Rico
-
 Qatar
Qatar
-
 Reunion
-
 Romania
-
 Rwanda
-
 Saudi Arabia
-
 Serbia
-
 Singapore
-
 Slovakia
-
 Slovenia
-
 Somalia
-
 South Africa
-
 Spain
Spain
-
 Sri Lanka
-
 Sweden
-
 Switzerland
-
 Syria
Syria
-
 Taiwan
-
 Tajikistan
-
 Tanzania
-
 Thailand
-
 Trinidad and Tobago
-
 Tunisia
-
 Turkey
-
 UAE
UAE
-
 Uganda
-
 Ukraine
-
 United Kingdom
-
United States
-
 Uruguay
-
 Uzbekistan
-
 Venezuela
-
 Vietnam
-
 Yemen
Yemen
-
 Zambia
-
 Zimbabwe
- Forex
- Crypto
