

Quant: Strong selling momentum drives price lower, downtrend likely to persist

Quant (QNT) is trading at $62.98, which is well below the MA-20 ($75.51), MA-50 ($75.08), and MA-200 ($91.10), signaling persistent selling pressure across short-, medium-, and long-term horizons. The nearest dynamic resistance is seen at the Ichimoku Kijun ($75.89), while local support remains untested below the current level.
QNT price prediction
Current price:
$198.65
2.22
1.13%
Real-time Data
06:10
Daily range
194.64
 198.43
Weekly range
185.350000
210.980000
210.980000
Loading...
Highlights
- QNT trades at $62.98, significantly below the MA-20 ($75.51), MA-50 ($75.08), and MA-200 ($91.10), reflecting persistent selling pressure.
- Momentum indicators—including MACD, RSI, and CCI—are firmly bearish or oversold on both daily and weekly timeframes, confirming strong downside momentum.
- For the next five trading days, QNT is likely constrained within $60.00–$69.00, with less than 20% probability of a meaningful upward move absent a break above $69.00.
Aligned bearish signals as oversold technicals reinforce weak momentum
Momentum indicators point firmly downward. The MACD shows persistent bearish momentum on both daily and weekly timeframes, while the ADX value remains low, indicating that the downtrend may lack strong conviction. Both RSI and Stochastic RSI on daily and weekly charts are in sell or oversold zones, echoed by an oversold Commodity Channel Index, confirming a market that is technically stretched to the downside. Bull/Bear Power remains deeply negative, reinforcing that sellers currently dominate. The Awesome Oscillator supports this bearish tone. The price fell 7.01% on the day, with no significant gap at the open, and it now sits near the lower bound of today’s range ($62.76 – $66.49), suggesting high intraday volatility with continued pressure after the open. Notably, the signals from momentum and oscillators consistently align with the sharp daily sell-off and establish a cohesive bearish short-term picture.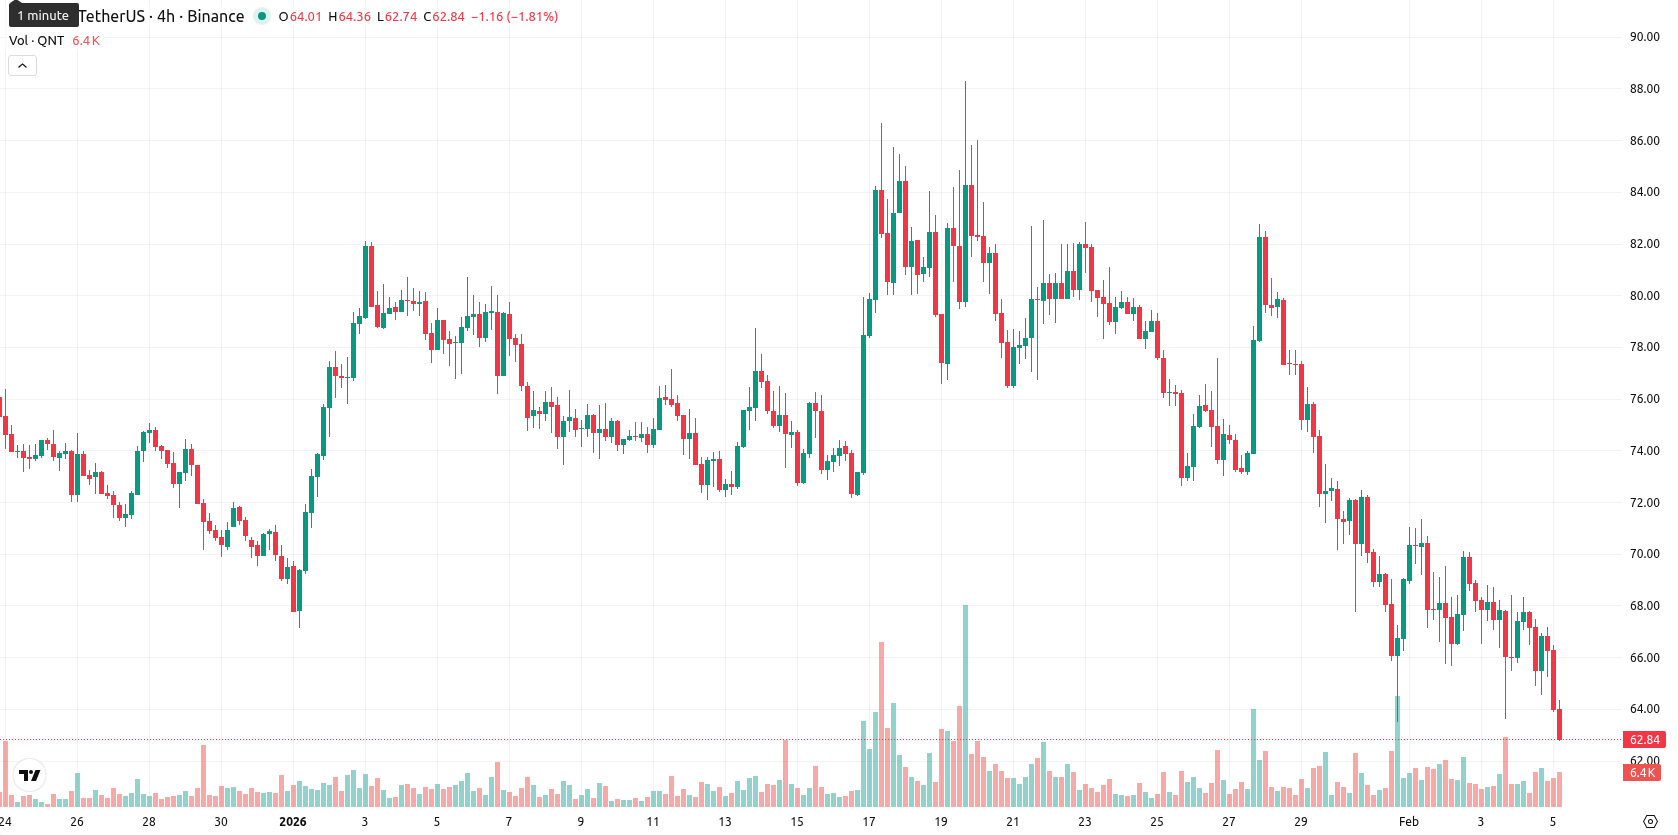
Sideways trading likely as further declines outweigh upside risk
For the coming five trading days, the likely price range is adjusted to $60.00 – $69.00 to indicate the typical volatility band relative to current levels. There is a very low probability (less than 20%) of a meaningful price increase, making a further decline far more likely. In the baseline scenario, QNT trades sideways, constrained within $60.00 – $69.00. A bullish case would require a decisive move above resistance at $69.00, targeting a return toward the $75 – $76 area, but this is unlikely near-term. Any fresh break below $60.00 could trigger another leg lower, extending the bearish trend.
Viktoras Karapetjanc, expert at Traders Union, sees Quant (QNT) under persistent pressure after breaking well below key moving averages. He believes momentum is firmly negative and that sellers remain in firm control. Short-term stabilization could occur within the $60.00 – $69.00 range. Macro and sentiment conditions offer little fundamental support for a rapid recovery. "If QNT can hold above $60.00, a short-term pause is possible, but real optimism starts only if the price reclaims the $69.00 level."
Last time, analysts noted that Quant is under sustained selling pressure, trading well below its key weekly moving averages, with technical indicators such as RSI, MACD, and oscillators reflecting deep oversold conditions and ongoing bearish momentum. The closest resistance stands at the Ichimoku Kijun line, while the absence of nearby support and persistent volatility suggest that downside risks remain dominant unless a decisive move above resistance occurs.
Source of Data:
QNT Price Analysis by TU
The analysis is based on a proprietary model combining technical, on-chain, and expert data. Not investment advice. See
methodology
The information is based on forecasts and does not constitute investment advice or a guarantee of future results. Market conditions may change. See our Disclaimer and Editorial Integrity for details.
Subscribe to TU news


Did you like the article?






Top News


Top 5 companies for you

United States
-
 Afghanistan
-
 Albania
-
 Algeria
-
 Angola
-
 Argentina
-
 Armenia
-
 Australia
-
 Austria
-
 Azerbaijan
-
 Bahamas
-
 Bahrain
-
 Bangladesh
-
 Belarus
-
 Belgium
-
 Bolivia
-
 Botswana
-
 Brazil
-
 Brunei
-
 Bulgaria
-
 Cambodia
-
 Cameroon
-
 Canada
-
 Chile
-
 China
-
 Colombia
-
 Congo
-
 Costa Rica
-
 Cote d'Ivoire
-
 Croatia
-
 Cuba
-
 Cyprus
-
 Czechia
-
 DR Congo
-
 Denmark
-
 Dominican Republic
-
 Ecuador
-
 Egypt
-
 El Salvador
-
 Estonia
-
 Eswatini
-
 Ethiopia
-
 Finland
-
 France
-
 Georgia
-
 Germany
-
 Ghana
-
 Greece
-
 Haiti
-
 Hong Kong
-
 Hungary
-
 India
-
 Indonesia
-
 Iran, Islamic republic
-
 Iraq
-
 Ireland
-
 Israel
-
 Italy
-
 Jamaica
-
 Japan
-
 Jordan
-
 Kazakhstan
-
 Kenya
-
 Korea
-
 Kuwait
-
 Kyrgyzstan
-
 Laos
-
 Latvia
-
 Lebanon
-
 Lesotho
-
 Libya
-
 Lithuania
-
 Luxembourg
-
 Madagascar
-
 Malaysia
-
 Malta
-
 Mauritius
-
 Mexico
-
 Moldova
-
 Mongolia
-
 Montenegro
-
 Morocco
-
 Mozambique
-
 Myanmar
-
 Namibia
-
 Nepal
-
 Netherlands
-
 New Zealand
-
 Nigeria
-
 North Macedonia
-
 Norway
-
 Oman
-
 Pakistan
-
 Palestine
-
 Panama
-
 Papua New Guinea
-
 Paraguay
-
 Peru
-
 Philippines
-
 Poland
-
 Portugal
-
 Puerto Rico
-
 Qatar
-
 Reunion
-
 Romania
-
 Rwanda
-
 Saudi Arabia
-
 Serbia
-
 Singapore
-
 Slovakia
-
 Slovenia
-
 Somalia
-
 South Africa
-
 Spain
-
 Sri Lanka
-
 Sweden
-
 Switzerland
-
 Syria
-
 Taiwan
-
 Tajikistan
-
 Tanzania
-
 Thailand
-
 Trinidad and Tobago
-
 Tunisia
-
 Turkey
-
 UAE
-
 Uganda
-
 Ukraine
-
 United Kingdom
-
United States
-
 Uruguay
-
 Uzbekistan
-
 Venezuela
-
 Vietnam
-
 Yemen
-
 Zambia
-
 Zimbabwe
- Forex
- Crypto










Live News


