
Dogecoin price prediction: More downside likely as DOGE tumbles below key moving averages

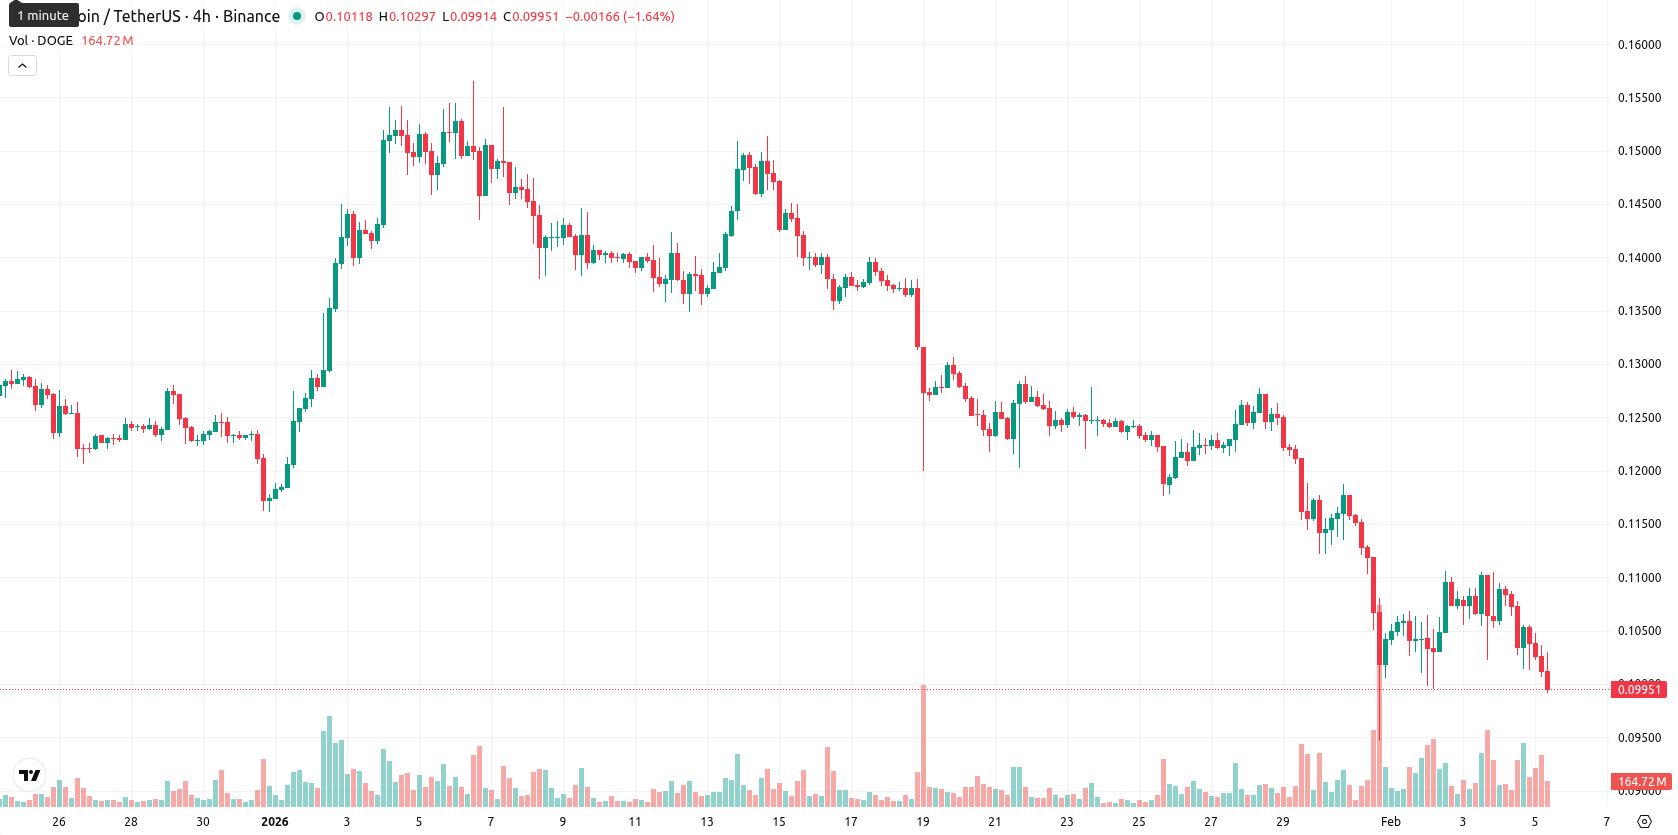
Dogecoin (DOGE) is currently trading at $0.09939, which is significantly below all key Moving Averages: MA-20 ($0.12064), MA-50 ($0.12894), and MA-200 ($0.18593). This places the asset under sustained short-, medium-, and long-term downside pressure, and positions the nearest dynamic resistance at the Ichimoku Kijun level of $0.12297.
Highlights
- Dogecoin network activity surged in early 2026, with active addresses rising by 36% to over 71,400, reflecting increased participation.
- Futures open interest in Dogecoin fell 8.7% to $1.16 billion as traders reduced exposure amid market caution, despite brief reactions to Musk's SpaceX DOGE-1 news.
- DOGE trades at $0.09939, significantly below key moving averages, with strong bearish momentum and a near-term price range expected between $0.095 and $0.105.
Network activity surge offset by cautious futures flows, Musk remarks fade
Dogecoin network activity increased sharply in early 2026, with active addresses rising by 36% to over 71,400 as participation picked up. Futures open interest in Dogecoin contracted by 8.7% to $1.16 billion as traders reduced their exposure amid heightened market caution. Recent public statements from Elon Musk regarding Dogecoin and confirmations of SpaceX's planned DOGE-1 Moon mission in 2027 led to immediate but short-lived market reactions.
Bearish momentum accelerates as oscillators flag deeply oversold
Momentum signals remain bearish, with the MACD and ADX confirming strong downward momentum on the daily timeframe. RSI is near 30, and both Stochastic RSI and CCI are in oversold territory, highlighting a stretched selloff with no clear reversal yet. Bull/Bear Power favors sellers, indicating a dominant bearish tone intraday, while the Awesome Oscillator continues to point lower. The session opened without a significant gap and has since moved sharply lower — down 7.76% since the open — closing near today's low, which underscores high intraday volatility and persistent selling pressure.
Rangebound bias as low breakout odds limit recovery prospects
For the next five trading days, DOGE is expected to remain within a $0.095 to $0.105 range, following a typical volatility band relative to current levels. Momentum and directional indicators on the weekly chart point to a low probability (less than 20%) of a price increase in the short term, making further downside movement more likely. In the baseline scenario, DOGE is likely to trade sideways in this narrow range. A bullish shift would require a breakout above the $0.105 and $0.12297 resistance area, while a drop below $0.095 could accelerate declines if selling pressure persists.
Last time, analysts noted that Dogecoin remains firmly mid-cap and has significantly underperformed the broader crypto market, with episodic trading volume and price trends dictated largely by retail sentiment cycles rather than network fundamentals. Technicals point to continued volatility, with key support likely near current levels, resistance in the $0.18–$0.30 range, and momentum indicators such as RSI and MACD reflecting a lack of sustained bullish momentum amid a structurally inflationary supply environment.


-
 Afghanistan
-
 Albania
-
 Algeria
-
 Angola
-
 Argentina
-
 Armenia
-
 Australia
-
 Austria
-
 Azerbaijan
-
 Bahamas
-
 Bahrain
-
 Bangladesh
-
 Belarus
-
 Belgium
-
 Bolivia
-
 Botswana
-
 Brazil
-
 Brunei
-
 Bulgaria
-
 Cambodia
-
 Cameroon
-
 Canada
-
 Chile
Chile
-
 China
China
-
 Colombia
-
 Congo
Congo
-
 Costa Rica
-
 Cote d'Ivoire
-
 Croatia
-
 Cuba
Cuba
-
 Cyprus
-
 Czechia
-
 DR Congo
-
 Denmark
-
 Dominican Republic
-
 Ecuador
-
 Egypt
Egypt
-
 El Salvador
-
 Estonia
-
 Eswatini
-
 Ethiopia
-
 Finland
-
 France
-
 Georgia
-
 Germany
-
 Ghana
Ghana
-
 Greece
-
 Haiti
Haiti
-
 Hong Kong
-
 Hungary
-
 India
India
-
 Indonesia
-
 Iran, Islamic republic
-
 Iraq
Iraq
-
 Ireland
-
 Israel
-
 Italy
Italy
-
 Jamaica
-
 Japan
Japan
-
 Jordan
-
 Kazakhstan
-
 Kenya
Kenya
-
 Korea
Korea
-
 Kuwait
-
 Kyrgyzstan
-
 Laos
Laos
-
 Latvia
-
 Lebanon
-
 Lesotho
-
 Libya
Libya
-
 Lithuania
-
 Luxembourg
-
 Madagascar
-
 Malaysia
-
 Malta
Malta
-
 Mauritius
-
 Mexico
-
 Moldova
-
 Mongolia
-
 Montenegro
-
 Morocco
-
 Mozambique
-
 Myanmar
-
 Namibia
-
 Nepal
Nepal
-
 Netherlands
-
 New Zealand
-
 Nigeria
-
 North Macedonia
-
 Norway
-
 Oman
Oman
-
 Pakistan
-
 Palestine
-
 Panama
-
 Papua New Guinea
-
 Paraguay
-
 Peru
Peru
-
 Philippines
-
 Poland
-
 Portugal
-
 Puerto Rico
-
 Qatar
Qatar
-
 Reunion
-
 Romania
-
 Rwanda
-
 Saudi Arabia
-
 Serbia
-
 Singapore
-
 Slovakia
-
 Slovenia
-
 Somalia
-
 South Africa
-
 Spain
Spain
-
 Sri Lanka
-
 Sweden
-
 Switzerland
-
 Syria
Syria
-
 Taiwan
-
 Tajikistan
-
 Tanzania
-
 Thailand
-
 Trinidad and Tobago
-
 Tunisia
-
 Turkey
-
 UAE
UAE
-
 Uganda
-
 Ukraine
-
 United Kingdom
-
United States
-
 Uruguay
-
 Uzbekistan
-
 Venezuela
-
 Vietnam
-
 Yemen
Yemen
-
 Zambia
-
 Zimbabwe
- Forex
- Crypto
