

Arbitrum slides 13.19% as persistent selling keeps ARB at multi-month lows

Arbitrum (ARB) is currently trading at $0.1099, which is well below the MA-20 ($0.1645), MA-50 ($0.1863), and MA-200 ($0.3270). This configuration indicates continued pressure from sellers across the short, medium, and long term, with the nearest dynamic resistance now marked by the Ichimoku Kijun at $0.1660.
ARB price prediction
Current price:
$0.1843
-0.0149
7.48%
Real-time Data
17:37
Daily range
0.1903
 0.1999
0.1999
Weekly range
0.1621
0.2083
0.2083
Loading...
Highlights
- Arbitrum maintains strong fundamental momentum as a key Ethereum Layer 2, supporting 234 projects, 1.5 million daily transactions, and $2.8 billion in total value locked.
- Governance is highly active, with ARB holders voting on DAO fund allocations and a $2.1 billion treasury supporting development, grants, and ecosystem incentives.
- ARB trades at $0.1099, well below major moving averages, with technicals pointing to a continued bearish trend and a 7-day support range of $0.099–$0.122.
Ecosystem growth and DAO activity as Arbitrum strengthens layer 2 role
Arbitrum continues to strengthen its position as a key Layer 2 scaling solution for Ethereum by leveraging optimistic rollup architecture to offer lower fees and high transaction throughput. The protocol now supports more than 234 ecosystem projects and handles around 1.5 million daily transactions, with over $2.8 billion in total value locked. ARB holders actively participate in decentralized governance via on-chain voting, with the DAO treasury holding about $2.1 billion in assets to fund development initiatives including the Short-Term Incentive Program and Catalyst grants.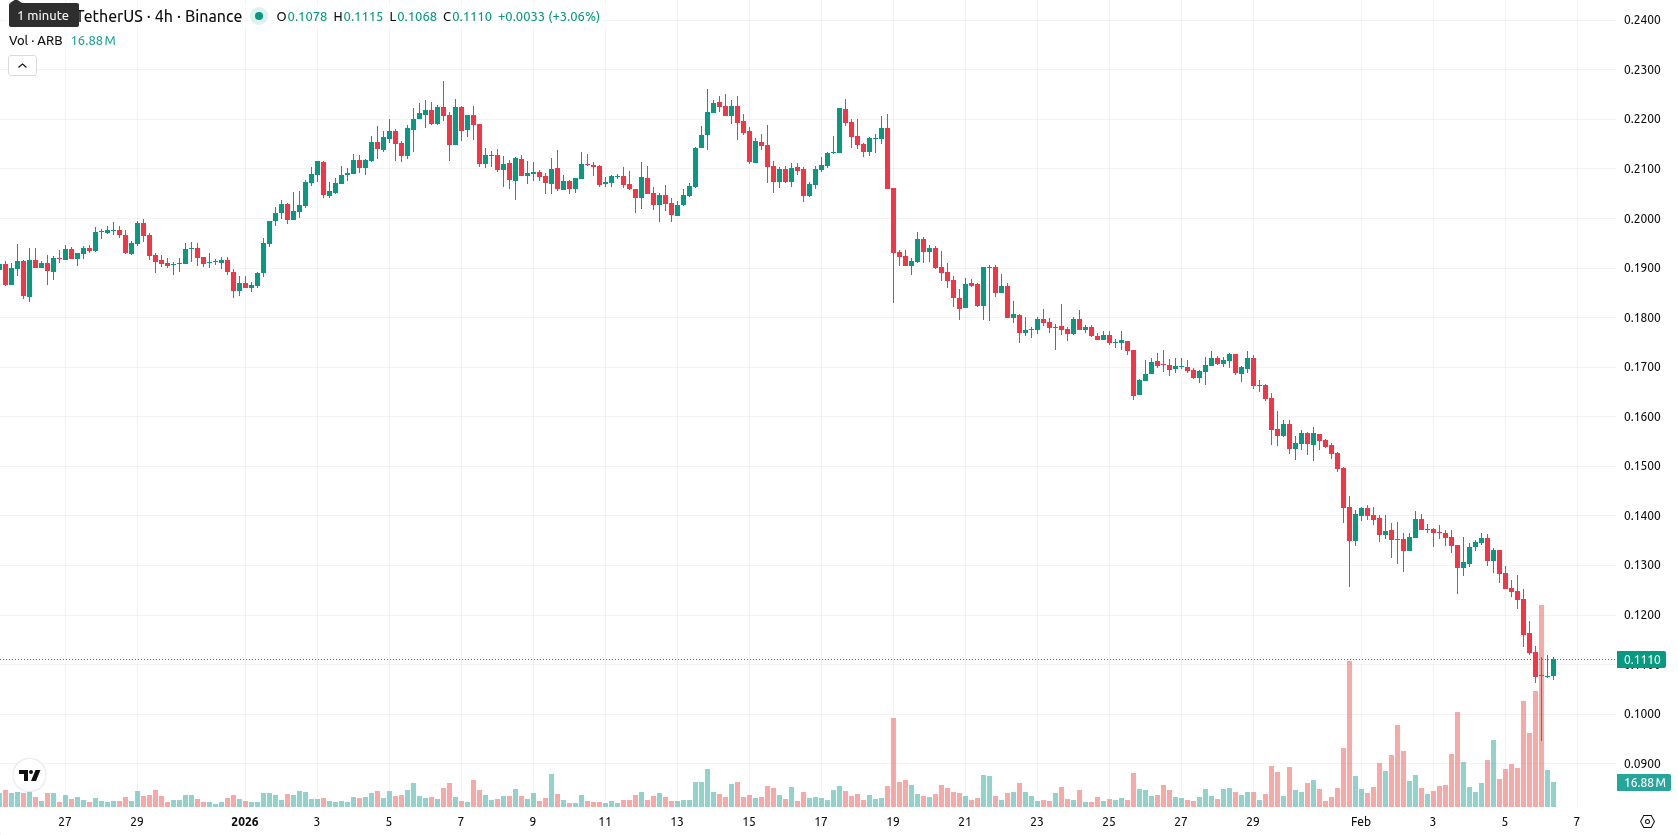
Oversold momentum and volatility spikes as sellers dominate session
Momentum signals remain weak, as both the MACD and ADX project a sell bias and reinforce the ongoing downtrend. The extremely low values in the RSI, Stochastic RSI, and CCI confirm a deeply oversold state, suggesting the market could be primed for a bounce but is currently dominated by sellers according to Bull/Bear Power. The Awesome Oscillator also aligns with the downward trend. Today’s session opened with a noticeable gap down from the previous close, and after slipping 13.19%, ARB now sits closer to the top end of its daily range with a high level of intraday volatility, reflecting persistent pressure after the open. The clear dominance of negative momentum and oversold oscillators provides little contradiction in the current session.Downward bias prevails as price risks breach of support band
Looking ahead, the expected price range for ARB over the next week is adjusted to $0.099–$0.122 to reflect typical volatility relative to current levels. The probability of a price increase in the short term is very low (less than 20%), making a further decline much more likely. In the baseline scenario, ARB consolidates sideways within this volatility band. A recovery above $0.122 would indicate short-term stabilization, while a break below $0.099 signals renewed selling pressure and further downside risk.
Viktoras Karapetjanc, analyst at Traders Union, sees Arbitrum’s core fundamentals as robust, with growing adoption and substantial DAO backing. He acknowledges strong selling pressure and negative momentum dominating the current price action. However, Karapetjanc believes that deep oversold conditions and the protocol’s expanding ecosystem provide a foundation for eventual recovery. "Despite the downtrend, ARB’s fundamentals remain strong — I see this phase as an opportunity for patient, long-term investors ready to withstand short-term volatility."
Arbitrum remains under sustained downside pressure, trading well below key short, medium, and long-term moving averages while bearish momentum indicators such as MACD, ADX, and a deeply oversold RSI reinforce the prevailing negative trend. Immediate resistance is defined by the Ichimoku Kijun line with support limited to recent intraday lows, highlighting significant downside risk and persistent volatility.
Source of Data:
ARB Price Analysis by TU
The analysis is based on a proprietary model combining technical, on-chain, and expert data. Not investment advice. See
methodology
The information is based on forecasts and does not constitute investment advice or a guarantee of future results. Market conditions may change. See our Disclaimer and Editorial Integrity for details.
Subscribe to TU news


Did you like the article?






Top News


Top 5 companies for you

United States
-
 Afghanistan
-
 Albania
-
 Algeria
-
 Angola
-
 Argentina
-
 Armenia
-
 Australia
-
 Austria
-
 Azerbaijan
-
 Bahamas
-
 Bahrain
-
 Bangladesh
-
 Belarus
-
 Belgium
-
 Bolivia
-
 Botswana
-
 Brazil
-
 Brunei
-
 Bulgaria
-
 Cambodia
-
 Cameroon
-
 Canada
-
 Chile
Chile
-
 China
China
-
 Colombia
-
 Congo
Congo
-
 Costa Rica
-
 Cote d'Ivoire
-
 Croatia
-
 Cuba
Cuba
-
 Cyprus
-
 Czechia
-
 DR Congo
-
 Denmark
-
 Dominican Republic
-
 Ecuador
-
 Egypt
Egypt
-
 El Salvador
-
 Estonia
-
 Eswatini
-
 Ethiopia
-
 Finland
-
 France
-
 Georgia
-
 Germany
-
 Ghana
Ghana
-
 Greece
-
 Haiti
Haiti
-
 Hong Kong
-
 Hungary
-
 India
India
-
 Indonesia
-
 Iran, Islamic republic
-
 Iraq
Iraq
-
 Ireland
-
 Israel
-
 Italy
Italy
-
 Jamaica
-
 Japan
Japan
-
 Jordan
-
 Kazakhstan
-
 Kenya
Kenya
-
 Korea
Korea
-
 Kuwait
-
 Kyrgyzstan
-
 Laos
Laos
-
 Latvia
-
 Lebanon
-
 Lesotho
-
 Libya
Libya
-
 Lithuania
-
 Luxembourg
-
 Madagascar
-
 Malaysia
-
 Malta
Malta
-
 Mauritius
-
 Mexico
-
 Moldova
-
 Mongolia
-
 Montenegro
-
 Morocco
-
 Mozambique
-
 Myanmar
-
 Namibia
-
 Nepal
Nepal
-
 Netherlands
-
 New Zealand
-
 Nigeria
-
 North Macedonia
-
 Norway
-
 Oman
Oman
-
 Pakistan
-
 Palestine
-
 Panama
-
 Papua New Guinea
-
 Paraguay
-
 Peru
Peru
-
 Philippines
-
 Poland
-
 Portugal
-
 Puerto Rico
-
 Qatar
Qatar
-
 Reunion
-
 Romania
-
 Rwanda
-
 Saudi Arabia
-
 Serbia
-
 Singapore
-
 Slovakia
-
 Slovenia
-
 Somalia
-
 South Africa
-
 Spain
Spain
-
 Sri Lanka
-
 Sweden
-
 Switzerland
-
 Syria
Syria
-
 Taiwan
-
 Tajikistan
-
 Tanzania
-
 Thailand
-
 Trinidad and Tobago
-
 Tunisia
-
 Turkey
-
 UAE
UAE
-
 Uganda
-
 Ukraine
-
 United Kingdom
-
United States
-
 Uruguay
-
 Uzbekistan
-
 Venezuela
-
 Vietnam
-
 Yemen
Yemen
-
 Zambia
-
 Zimbabwe
- Forex
- Crypto










Live News


