
-7.87% for Floki — oversold momentum dominates as support zones break lower

Floki (FLOKI) is trading at $0.0000305, which is well below the MA-20 ($0.00004022), MA-50 ($0.00004415), and MA-200 ($0.00007260), confirming strong bearish pressure across short-, medium-, and long-term timeframes. Immediate dynamic resistance is marked by the Ichimoku Kijun at $0.00004236, while there is no significant dynamic support above the current price.
FLOKI price prediction
Current price:
$ 0.0000218
0.0000001
0.69%
Real-time Data
08:28
Daily range
0.0000213
 0.00002
Weekly range
0.00002113
0.00002555
Loading...
Highlights
- Floki maintains a market capitalization near $481 million while expanding its ecosystem beyond meme coin origins with Valhalla NFT gaming and FlokiFi DeFi products.
- The project's multi-product strategy targets sectors such as gaming and education and is supported by recent partnerships and increased media attention.
- FLOKI trades at $0.0000305, well below key moving averages, with strong bearish momentum, oversold indicators (RSI 24.56), and a likely range of $0.0000275–$0.0000335 for the coming week.
Ecosystem expansion drives attention despite meme coin past
Floki continues to develop its ecosystem beyond meme coin origins, maintaining a market capitalization near $481 million. The project has expanded through its Valhalla NFT gaming platform and FlokiFi DeFi offerings while building partnerships and focusing on sectors such as gaming and education. Recent media attention highlights Floki's multi-product strategy.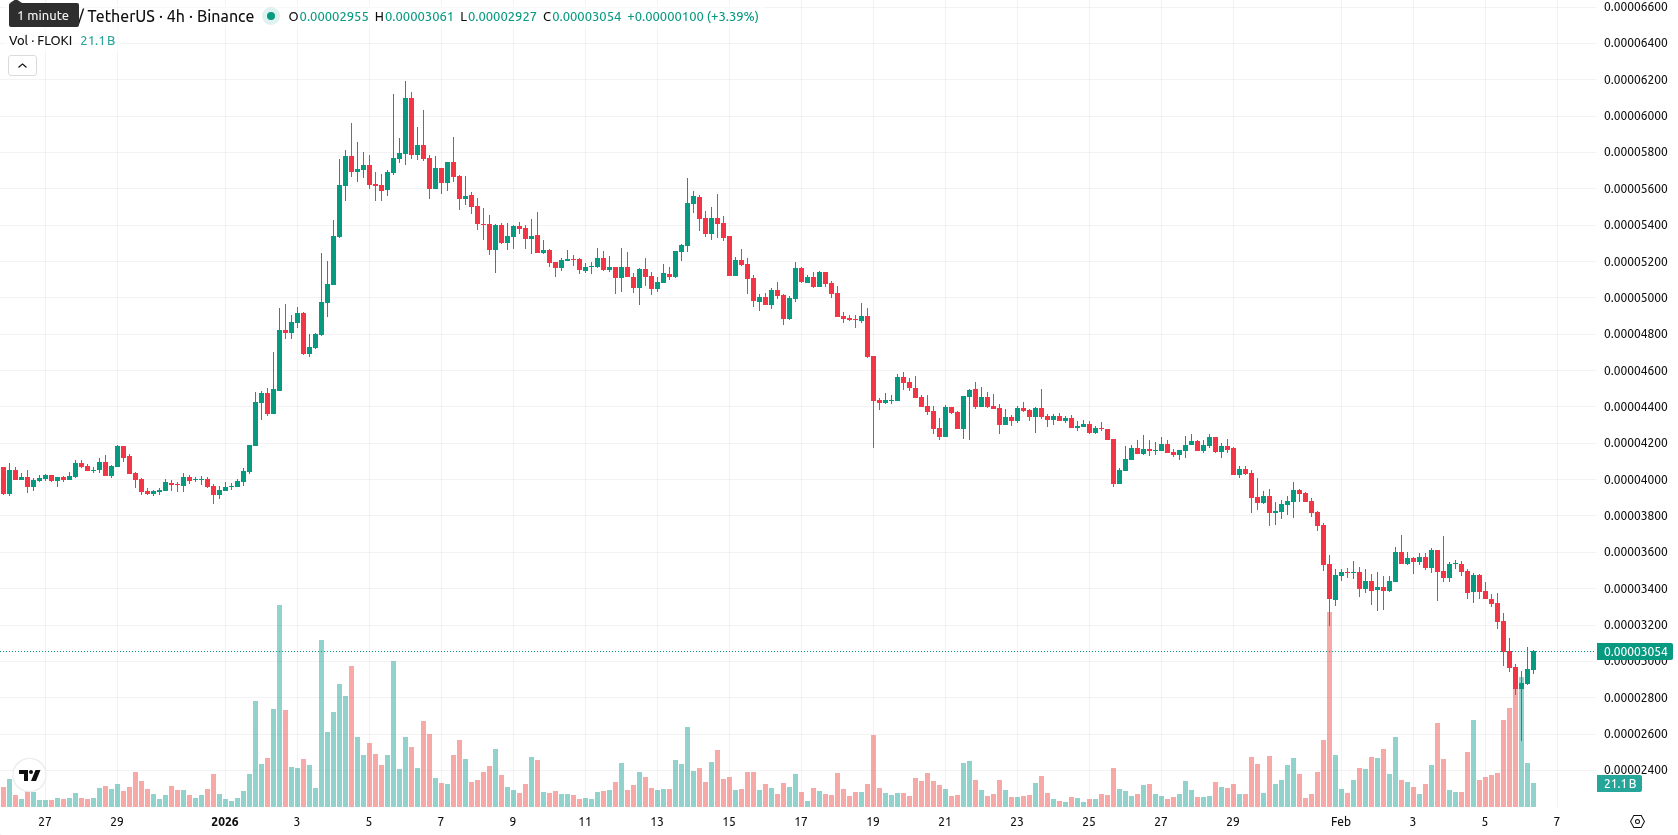
Oversold momentum and elevated volatility reinforce downward trajectory
Momentum indicators remain negative: the MACD signals a sell and the ADX (29.5%) indicates a steady downtrend. Both the RSI (24.56) and Commodity Channel Index (-161) indicate strong oversold conditions, while the Stochastic RSI is at its lowest possible value, marking clear oversold territory. Bull/Bear Power confirms seller dominance, and the Awesome Oscillator also aligns with the ongoing bearish trend. The session opened with a noticeable gap down from the previous close ($0.0000330 to $0.0000285), and despite some recovery, the price is near the top of today's range ($0.0000256–$0.0000308) but still posts a daily decline of 7.87%. Volatility has been high, with pronounced downward pressure persisting after the open—momentum and intraday dynamics are aligned in supporting a bearish outlook.Further losses favored as sideways range and bearish bias persist
For the coming week, the expected price range is $0.0000275–$0.0000335, reflecting the current volatility band relative to existing levels. The probability of a meaningful price increase is very low (less than 20%), making further declines more likely. The baseline scenario is for FLOKI to consolidate sideways within this range. A breakout above resistance near $0.0000335 could open a move higher, while weakness below $0.0000275 would confirm continuation of the downtrend.
Anton Kharitonov, analyst at Traders Union, sees clear signs of ongoing bearish momentum in FLOKI, with price action well below all major moving averages and oversold indicators dominating. He notes that despite ecosystem progress and recent media attention, the technical outlook remains poor and near-term upside is unlikely. Sideways consolidation within the $0.0000275 — $0.0000335 range is the base case, with a bias toward further declines if support fails. "Until FLOKI breaks above $0.0000335 or shows definite trend reversal, I remain defensive and would avoid new longs."
Previously it was reported that Floki Inu continues to trade well below key moving averages, with persistent bearish momentum confirmed by negative readings from the MACD, RSI, and other core oscillators. Strong resistance near the Ichimoku Kijun and oversold signals across multiple indicators suggest a high probability of further declines, with consolidation expected within a lower trading range unless a decisive breakout occurs.
Source of Data:
FLOKI Price Analysis by TU
The analysis is based on a proprietary model combining technical, on-chain, and expert data. Not investment advice. See
methodology
The information is based on forecasts and does not constitute investment advice or a guarantee of future results. Market conditions may change. See our Disclaimer and Editorial Integrity for details.
Subscribe to TU news

Did you like the article?


Latest Floki News


Weekly Top Bonuses

Top News


Top 5 companies for you

United States
-
 Afghanistan
-
 Albania
-
 Algeria
-
 Angola
-
 Argentina
-
 Armenia
-
 Australia
-
 Austria
-
 Azerbaijan
-
 Bahamas
-
 Bahrain
-
 Bangladesh
-
 Belarus
-
 Belgium
-
 Bolivia
-
 Botswana
-
 Brazil
-
 Brunei
-
 Bulgaria
-
 Cambodia
-
 Cameroon
-
 Canada
-
 Chile
Chile
-
 China
China
-
 Colombia
-
 Congo
Congo
-
 Costa Rica
-
 Cote d'Ivoire
-
 Croatia
-
 Cuba
Cuba
-
 Cyprus
-
 Czechia
-
 DR Congo
-
 Denmark
-
 Dominican Republic
-
 Ecuador
-
 Egypt
Egypt
-
 El Salvador
-
 Estonia
-
 Eswatini
-
 Ethiopia
-
 Finland
-
 France
-
 Georgia
-
 Germany
-
 Ghana
Ghana
-
 Greece
-
 Haiti
Haiti
-
 Hong Kong
-
 Hungary
-
 India
India
-
 Indonesia
-
 Iran, Islamic republic
-
 Iraq
Iraq
-
 Ireland
-
 Israel
-
 Italy
Italy
-
 Jamaica
-
 Japan
Japan
-
 Jordan
-
 Kazakhstan
-
 Kenya
Kenya
-
 Korea
Korea
-
 Kuwait
-
 Kyrgyzstan
-
 Laos
Laos
-
 Latvia
-
 Lebanon
-
 Lesotho
-
 Libya
Libya
-
 Lithuania
-
 Luxembourg
-
 Madagascar
-
 Malaysia
-
 Malta
Malta
-
 Mauritius
-
 Mexico
-
 Moldova
-
 Mongolia
-
 Montenegro
-
 Morocco
-
 Mozambique
-
 Myanmar
-
 Namibia
-
 Nepal
Nepal
-
 Netherlands
-
 New Zealand
-
 Nigeria
-
 North Macedonia
-
 Norway
-
 Oman
Oman
-
 Pakistan
-
 Palestine
-
 Panama
-
 Papua New Guinea
-
 Paraguay
-
 Peru
Peru
-
 Philippines
-
 Poland
-
 Portugal
-
 Puerto Rico
-
 Qatar
Qatar
-
 Reunion
-
 Romania
-
 Rwanda
-
 Saudi Arabia
-
 Serbia
-
 Singapore
-
 Slovakia
-
 Slovenia
-
 Somalia
-
 South Africa
-
 Spain
Spain
-
 Sri Lanka
-
 Sweden
-
 Switzerland
-
 Syria
Syria
-
 Taiwan
-
 Tajikistan
-
 Tanzania
-
 Thailand
-
 Trinidad and Tobago
-
 Tunisia
-
 Turkey
-
 UAE
UAE
-
 Uganda
-
 Ukraine
-
 United Kingdom
-
United States
-
 Uruguay
-
 Uzbekistan
-
 Venezuela
-
 Vietnam
-
 Yemen
Yemen
-
 Zambia
-
 Zimbabwe
- Forex
- Crypto
