

Oversold technicals drive rebound — Quant gains 7.27%

Quant (QNT) is trading at $65.37, showing a strong intraday gain of 7.27% after opening lower at $56.82 and ranging widely between $53.86 and $65.64. Despite today's bounce, QNT remains under technical pressure as the price is positioned below the MA-20 ($74.45), MA-50 ($74.73), and MA-200 ($90.80), indicating a bearish trend across all major timeframes.
QNT price prediction
Current price:
$199.15
2.94
1.50%
Real-time Data
05:50
Daily range
194.64
 198.43
Weekly range
185.350000
210.980000
210.980000
Loading...
Highlights
- QNT trades at $65.37, remaining below MA-20 ($74.45), MA-50 ($74.73), and MA-200 ($90.80), reinforcing sustained bearish momentum across all timeframes.
- Oscillators—including RSI at 30 and oversold Stochastic RSI and CCI—signal that QNT is deeply oversold, while momentum indicators such as the daily MACD and Awesome Oscillator both give sell forecasts.
- For the next five trading days, QNT is expected to consolidate between support near $62.50–$65.00 and resistance at $71.95, with less than a 20% probability of short-term price recovery.
Bearish momentum persists as QNT holds below major resistance
Key technical indicators reinforce the bearish outlook for QNT, with the current price remaining below all major moving averages and dynamic resistance forming at the Ichimoku Kijun level of $71.95. Strong support is observed in the $62.40–$65.00 region, while a break above $71.95 would be required to trigger a more meaningful reversal. Momentum remains weak as the MACD stays well below zero with a sell signal in place, the ADX reads only 17.0 to show trend indecisiveness, and a heavy build-up of oversold readings is seen across the RSI (near 30), Stochastic RSI, CCI, and Bull/Bear Power. The Awesome Oscillator also aligns with the bearish bias, suggesting further downside risk even after the volatile session.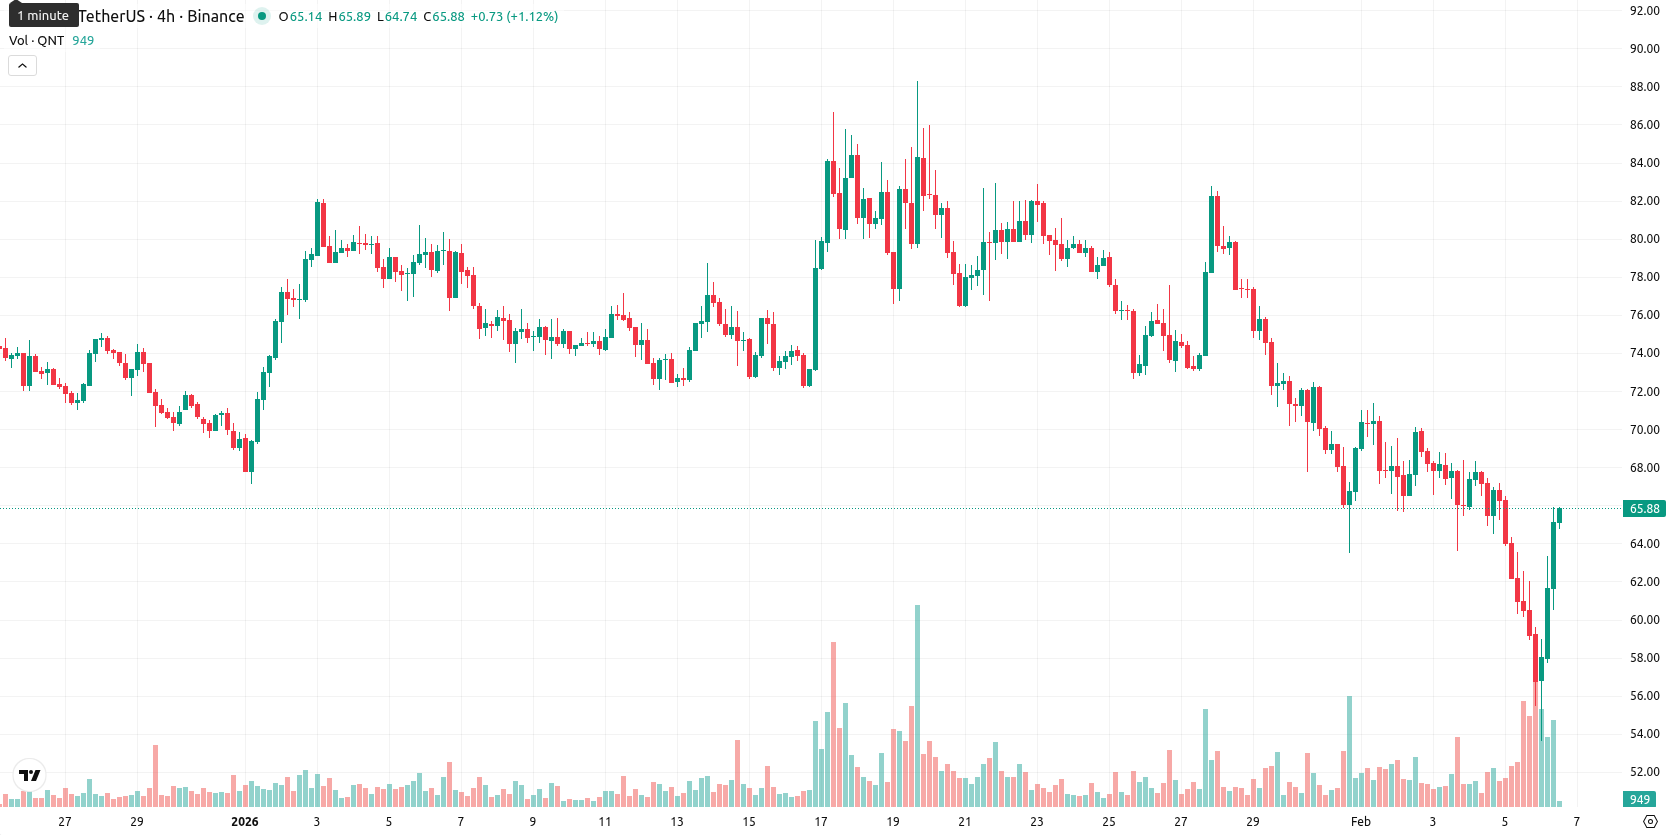
Further declines favored as oversold state and sellers persist
Over the next five trading days, QNT is expected to move within a $62.50–$70.00 volatility band relative to current levels. Given the persistence of negative momentum and muted buying signals, the probability of a continued price increase is below 20%, making further declines more likely. A consolidation phase between $62.50 and $70.00 is the base case as sellers and oversold conditions compete for influence. A break above $72.00 could prompt a short squeeze toward higher resistance, while a slide through $62.50 would expose the asset to renewed selling pressure.
Anton Kharitonov, expert at Traders Union, notes that Quant (QNT) continues to face strong technical headwinds despite a sharp intraday rebound. He highlights the persistence of bearish momentum, with price action capped below all major moving averages and weak momentum signals dominating. The analyst sees the base case as further consolidation between $62.50 and $70.00, with downside risk prevailing unless $72.00 is convincingly reclaimed. "Until QNT overcomes resistance above $72.00 and reverses key momentum signals, I remain defensively positioned and expect selling to dominate."
Previously it was reported that Quant remains under significant selling pressure, trading well below its key short-, medium-, and long-term moving averages, with major indicators such as RSI, Stochastic RSI, MACD, and the Commodity Channel Index all firmly in oversold or bearish territory. The closest resistance is marked by the Ichimoku Kijun line, while persistent volatility and the lack of tested nearby support suggest downside risks remain dominant, with limited probability of a sustained upside move in the near term.
Source of Data:
QNT Price Analysis by TU
The analysis is based on a proprietary model combining technical, on-chain, and expert data. Not investment advice. See
methodology
The information is based on forecasts and does not constitute investment advice or a guarantee of future results. Market conditions may change. See our Disclaimer and Editorial Integrity for details.
Subscribe to TU news


Did you like the article?






Top News


Top 5 companies for you

United States
-
 Afghanistan
-
 Albania
-
 Algeria
-
 Angola
-
 Argentina
-
 Armenia
-
 Australia
-
 Austria
-
 Azerbaijan
-
 Bahamas
-
 Bahrain
-
 Bangladesh
-
 Belarus
-
 Belgium
-
 Bolivia
-
 Botswana
-
 Brazil
-
 Brunei
-
 Bulgaria
-
 Cambodia
-
 Cameroon
-
 Canada
-
 Chile
-
 China
-
 Colombia
-
 Congo
-
 Costa Rica
-
 Cote d'Ivoire
-
 Croatia
-
 Cuba
-
 Cyprus
-
 Czechia
-
 DR Congo
-
 Denmark
-
 Dominican Republic
-
 Ecuador
-
 Egypt
-
 El Salvador
-
 Estonia
-
 Eswatini
-
 Ethiopia
-
 Finland
-
 France
-
 Georgia
-
 Germany
-
 Ghana
-
 Greece
-
 Haiti
-
 Hong Kong
-
 Hungary
-
 India
-
 Indonesia
-
 Iran, Islamic republic
-
 Iraq
-
 Ireland
-
 Israel
-
 Italy
-
 Jamaica
-
 Japan
-
 Jordan
-
 Kazakhstan
-
 Kenya
-
 Korea
-
 Kuwait
-
 Kyrgyzstan
-
 Laos
-
 Latvia
-
 Lebanon
-
 Lesotho
-
 Libya
-
 Lithuania
-
 Luxembourg
-
 Madagascar
-
 Malaysia
-
 Malta
-
 Mauritius
-
 Mexico
-
 Moldova
-
 Mongolia
-
 Montenegro
-
 Morocco
-
 Mozambique
-
 Myanmar
-
 Namibia
-
 Nepal
-
 Netherlands
-
 New Zealand
-
 Nigeria
-
 North Macedonia
-
 Norway
-
 Oman
-
 Pakistan
-
 Palestine
-
 Panama
-
 Papua New Guinea
-
 Paraguay
-
 Peru
-
 Philippines
-
 Poland
-
 Portugal
-
 Puerto Rico
-
 Qatar
-
 Reunion
-
 Romania
-
 Rwanda
-
 Saudi Arabia
-
 Serbia
-
 Singapore
-
 Slovakia
-
 Slovenia
-
 Somalia
-
 South Africa
-
 Spain
-
 Sri Lanka
-
 Sweden
-
 Switzerland
-
 Syria
-
 Taiwan
-
 Tajikistan
-
 Tanzania
-
 Thailand
-
 Trinidad and Tobago
-
 Tunisia
-
 Turkey
-
 UAE
-
 Uganda
-
 Ukraine
-
 United Kingdom
-
United States
-
 Uruguay
-
 Uzbekistan
-
 Venezuela
-
 Vietnam
-
 Yemen
-
 Zambia
-
 Zimbabwe
- Forex
- Crypto










Live News


