
Dogecoin price prediction: Will integration buzz on X trigger another rally? DOGE gains 18.72%

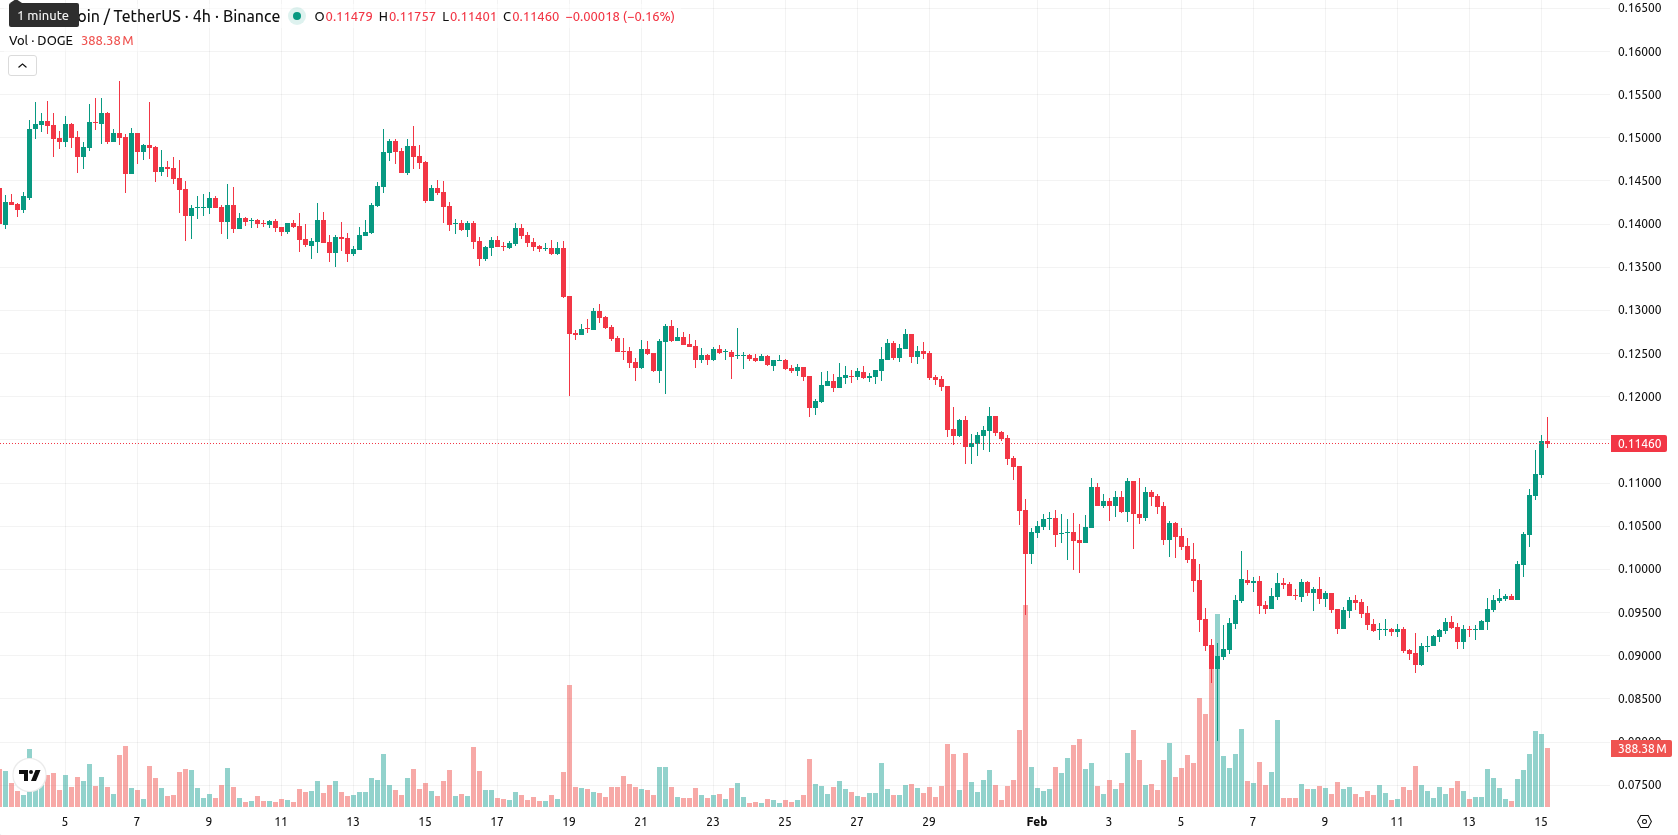
Dogecoin (DOGE) is trading at $0.11459, above its MA-20 at $0.10478 but below the MA-50 at $0.12259 and well under the MA-200 at $0.17848. This setup signals near-term bullish momentum, though DOGE remains under pressure over the medium and long term, with the MA-50 and Ichimoku Kijun at $0.10468 acting as dynamic support and resistance.
Highlights
- Dogecoin's price action remains driven by speculation of possible X platform payment integration amid recurring rumors linked to Elon Musk, with no formal confirmation yet.
- The Dogecoin network mints 5 billion DOGE per year, supplying approximately 168.71 billion DOGE in circulation, and its inflation rate is declining relative to total supply.
- DOGE trades at $0.11459 with intraday strength toward $0.11753, but faces technical resistance near $0.125 and risk of a pullback below $0.110.
Integration rumors and inflation data sustain community volatility
Dogecoin's recent activity has centered around growing speculation about potential integration with the X platform for payments, fueled by market buzz around Elon Musk's influence. Official updates confirm that the Dogecoin network mints 5 billion DOGE annually, with roughly 168.71 billion DOGE currently in circulation, reflecting a declining inflation rate relative to total supply. The asset's uncapped supply model and ongoing rumors of potential use for tipping or micro-payments on X have sustained both community interest and volatility, although no formal partnership or implementation has been confirmed.
Mixed momentum as intraday buyers battle overextended oscillators
On the technical front, momentum is mixed. The MACD on the daily chart signals a strong sell, while the ADX is elevated and tilts bearish, but the RSI remains neutral-bullish at 52.1. The Stochastic RSI is deeply overbought, and the Commodity Channel Index is neutral. Bull/Bear Power is in strong buy territory, showing buyers are dominant in intraday trading. The price is near session highs, but some oscillators warn of overextension, highlighting the energetic and volatile tone of the current move.
Limited upside with consolidation expected as breakout risks remain
DOGE is likely to trade in the $0.110 to $0.125 range over the next five sessions, representing a volatility band relative to current levels. With no weekly momentum indicators showing a buy signal, the chance of a further price increase is estimated below 20%. The baseline expectation is for consolidation between support at $0.110 and resistance just below $0.125. A breakout above $0.125 would be needed to trigger fresh upward momentum, while a decline below $0.110 could lead to additional downside toward lower support.
Previously it was reported that Dogecoin is trading above its 20-day moving average, indicating short-term upside momentum, but remains below both the 50- and 200-day moving averages, highlighting persistent medium- and long-term resistance. Technical indicators present a mixed outlook, with a moderately positive RSI, bearish MACD, and overbought Stoch RSI suggesting that while buyers currently dominate, the recent rally may be losing steam and a near-term pullback remains possible.


-
 Afghanistan
-
 Albania
-
 Algeria
-
 Angola
-
 Argentina
-
 Armenia
-
 Australia
-
 Austria
-
 Azerbaijan
-
 Bahamas
-
 Bahrain
-
 Bangladesh
-
 Belarus
-
 Belgium
-
 Bolivia
-
 Botswana
-
 Brazil
-
 Brunei
-
 Bulgaria
-
 Cambodia
-
 Cameroon
-
 Canada
-
 Chile
Chile
-
 China
China
-
 Colombia
-
 Congo
Congo
-
 Costa Rica
-
 Cote d'Ivoire
-
 Croatia
-
 Cuba
Cuba
-
 Cyprus
-
 Czechia
-
 DR Congo
-
 Denmark
-
 Dominican Republic
-
 Ecuador
-
 Egypt
Egypt
-
 El Salvador
-
 Estonia
-
 Eswatini
-
 Ethiopia
-
 Finland
-
 France
-
 Georgia
-
 Germany
-
 Ghana
Ghana
-
 Greece
-
 Haiti
Haiti
-
 Hong Kong
-
 Hungary
-
 India
India
-
 Indonesia
-
 Iran, Islamic republic
-
 Iraq
Iraq
-
 Ireland
-
 Israel
-
 Italy
Italy
-
 Jamaica
-
 Japan
Japan
-
 Jordan
-
 Kazakhstan
-
 Kenya
Kenya
-
 Korea
Korea
-
 Kuwait
-
 Kyrgyzstan
-
 Laos
Laos
-
 Latvia
-
 Lebanon
-
 Lesotho
-
 Libya
Libya
-
 Lithuania
-
 Luxembourg
-
 Madagascar
-
 Malaysia
-
 Malta
Malta
-
 Mauritius
-
 Mexico
-
 Moldova
-
 Mongolia
-
 Montenegro
-
 Morocco
-
 Mozambique
-
 Myanmar
-
 Namibia
-
 Nepal
Nepal
-
 Netherlands
-
 New Zealand
-
 Nigeria
-
 North Macedonia
-
 Norway
-
 Oman
Oman
-
 Pakistan
-
 Palestine
-
 Panama
-
 Papua New Guinea
-
 Paraguay
-
 Peru
Peru
-
 Philippines
-
 Poland
-
 Portugal
-
 Puerto Rico
-
 Qatar
Qatar
-
 Reunion
-
 Romania
-
 Rwanda
-
 Saudi Arabia
-
 Serbia
-
 Singapore
-
 Slovakia
-
 Slovenia
-
 Somalia
-
 South Africa
-
 Spain
Spain
-
 Sri Lanka
-
 Sweden
-
 Switzerland
-
 Syria
Syria
-
 Taiwan
-
 Tajikistan
-
 Tanzania
-
 Thailand
-
 Trinidad and Tobago
-
 Tunisia
-
 Turkey
-
 UAE
UAE
-
 Uganda
-
 Ukraine
-
 United Kingdom
-
United States
-
 Uruguay
-
 Uzbekistan
-
 Venezuela
-
 Vietnam
-
 Yemen
Yemen
-
 Zambia
-
 Zimbabwe
- Forex
- Crypto
