
Bonk: Buyer strength and MACD momentum drive double-digit price boost

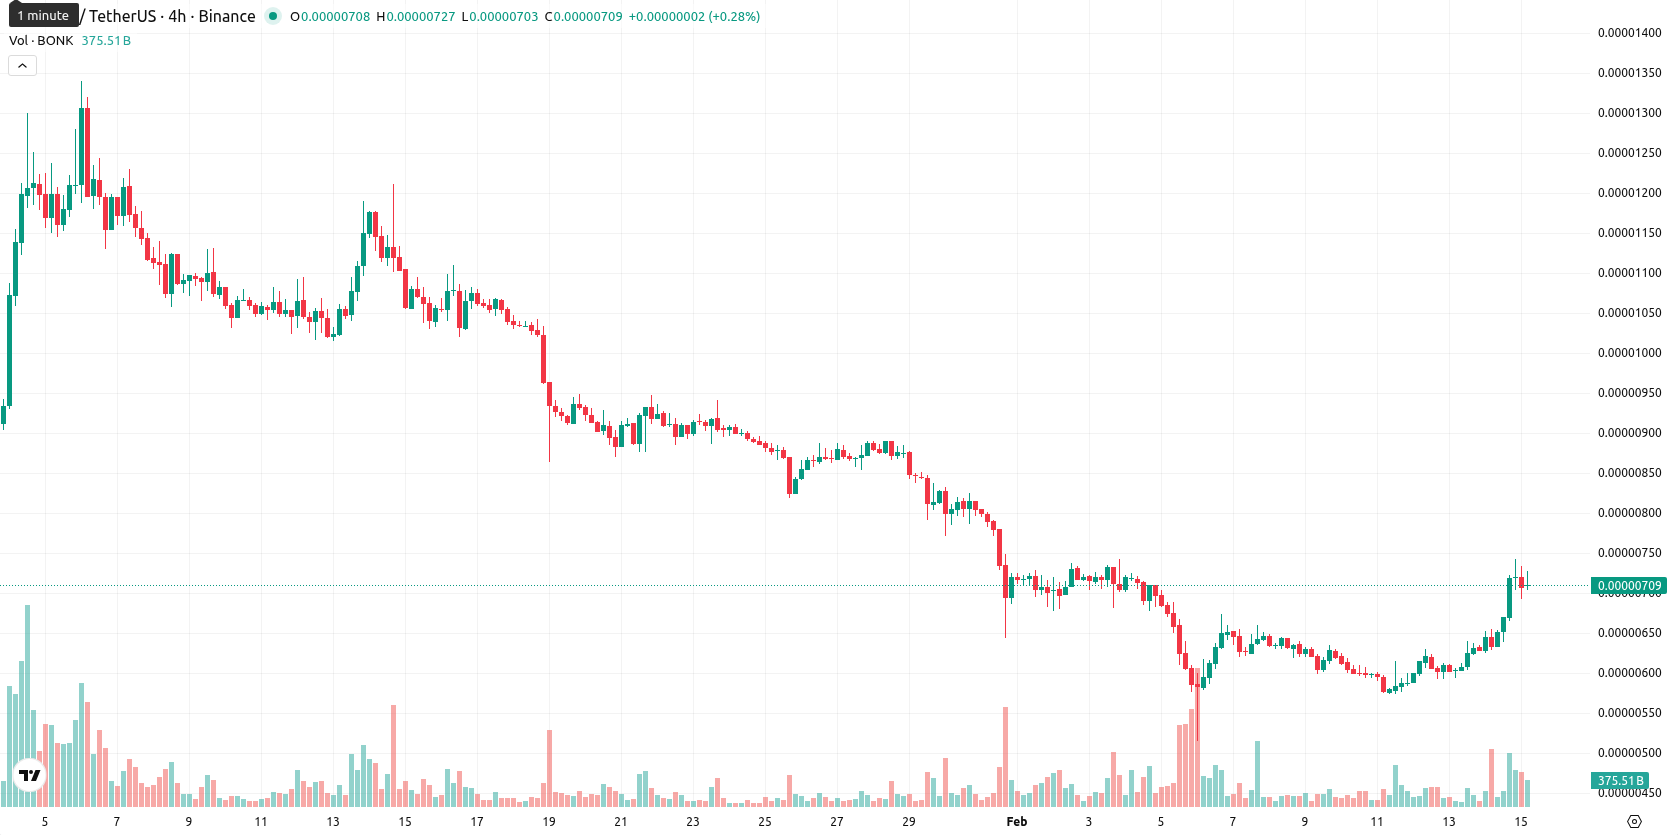
Bonk (BONK) is trading at $0.0000071, just above the MA-20 ($0.00000704). However, it remains below the MA-50 ($0.00000866) and the MA-200 ($0.00001475), indicating short-term strength but a longer-term bearish trend.
Highlights
- BONK trades at $0.0000071, just above the MA-20 but below both MA-50 ($0.00000866) and MA-200 ($0.00001475), signaling a short-term rebound within a broader downtrend.
- Momentum is mixed: the MACD indicates strong bearish momentum while the ADX reflects a dominant sell bias, despite a 12.68% price jump driven by intraday buyers.
- Expected five-day trading range is $0.00000640–$0.00000760 with less than 20% probability of upside; consolidation likely unless MA-50 resistance or $0.00000640 support breaks.
Bearish momentum persists amid overbought signals and strong session gains
Dynamic support for BONK is present at the Ichimoku Kijun ($0.00000731), while the MA-50 acts as a significant resistance. On the technical side, the MACD (D1) shows strong bearish momentum, and the ADX (D1) signals a prevailing sell bias with robust trend strength. The RSI sits at 48, which is neutral but leaning slightly bearish; the Stochastic RSI is overbought, and the CCI remains neutral, indicating a potential short-term overextension. Bull/Bear Power highlights buyers dominating throughout the session, supporting a notable 12.68% price jump and confirming upward pressure, while the Awesome Oscillator remains neutral on the D1 timeframe.
Limited upside as consolidation and downside risks dominate outlook
Looking ahead over the next five trading days, BONK is expected to fluctuate within the $0.00000640 to $0.00000760 range, reflecting typical volatility for this asset. The likelihood of further price increases is low (less than 20%), suggesting downside risks dominate. The baseline view anticipates consolidation within this band, though a breakout above the MA-50 could push prices upward, while a drop below $0.00000640 may trigger further declines.
Last time, analysts noted that Bonk (BONK) is showing short-term bullish momentum as it trades above the 20-day moving average but remains constrained below its 50- and 200-day moving averages, with key resistance near the MA-50 and support at the Kijun line. Momentum signals are mixed—MACD and ADX indicating ongoing selling pressure, while overbought oscillators and strong intraday gains warn that the latest rebound could struggle to sustain without stronger trend confirmation.


Latest Bonk News


-
 Afghanistan
-
 Albania
-
 Algeria
-
 Angola
-
 Argentina
-
 Armenia
-
 Australia
-
 Austria
-
 Azerbaijan
-
 Bahamas
-
 Bahrain
-
 Bangladesh
-
 Belarus
-
 Belgium
-
 Bolivia
-
 Botswana
-
 Brazil
-
 Brunei
-
 Bulgaria
-
 Cambodia
-
 Cameroon
-
 Canada
-
 Chile
Chile
-
 China
China
-
 Colombia
-
 Congo
Congo
-
 Costa Rica
-
 Cote d'Ivoire
-
 Croatia
-
 Cuba
Cuba
-
 Cyprus
-
 Czechia
-
 DR Congo
-
 Denmark
-
 Dominican Republic
-
 Ecuador
-
 Egypt
Egypt
-
 El Salvador
-
 Estonia
-
 Eswatini
-
 Ethiopia
-
 Finland
-
 France
-
 Georgia
-
 Germany
-
 Ghana
Ghana
-
 Greece
-
 Haiti
Haiti
-
 Hong Kong
-
 Hungary
-
 India
India
-
 Indonesia
-
 Iran, Islamic republic
-
 Iraq
Iraq
-
 Ireland
-
 Israel
-
 Italy
Italy
-
 Jamaica
-
 Japan
Japan
-
 Jordan
-
 Kazakhstan
-
 Kenya
Kenya
-
 Korea
Korea
-
 Kuwait
-
 Kyrgyzstan
-
 Laos
Laos
-
 Latvia
-
 Lebanon
-
 Lesotho
-
 Libya
Libya
-
 Lithuania
-
 Luxembourg
-
 Madagascar
-
 Malaysia
-
 Malta
Malta
-
 Mauritius
-
 Mexico
-
 Moldova
-
 Mongolia
-
 Montenegro
-
 Morocco
-
 Mozambique
-
 Myanmar
-
 Namibia
-
 Nepal
Nepal
-
 Netherlands
-
 New Zealand
-
 Nigeria
-
 North Macedonia
-
 Norway
-
 Oman
Oman
-
 Pakistan
-
 Palestine
-
 Panama
-
 Papua New Guinea
-
 Paraguay
-
 Peru
Peru
-
 Philippines
-
 Poland
-
 Portugal
-
 Puerto Rico
-
 Qatar
Qatar
-
 Reunion
-
 Romania
-
 Rwanda
-
 Saudi Arabia
-
 Serbia
-
 Singapore
-
 Slovakia
-
 Slovenia
-
 Somalia
-
 South Africa
-
 Spain
Spain
-
 Sri Lanka
-
 Sweden
-
 Switzerland
-
 Syria
Syria
-
 Taiwan
-
 Tajikistan
-
 Tanzania
-
 Thailand
-
 Trinidad and Tobago
-
 Tunisia
-
 Turkey
-
 UAE
UAE
-
 Uganda
-
 Ukraine
-
 United Kingdom
-
United States
-
 Uruguay
-
 Uzbekistan
-
 Venezuela
-
 Vietnam
-
 Yemen
Yemen
-
 Zambia
-
 Zimbabwe
- Forex
- Crypto
