
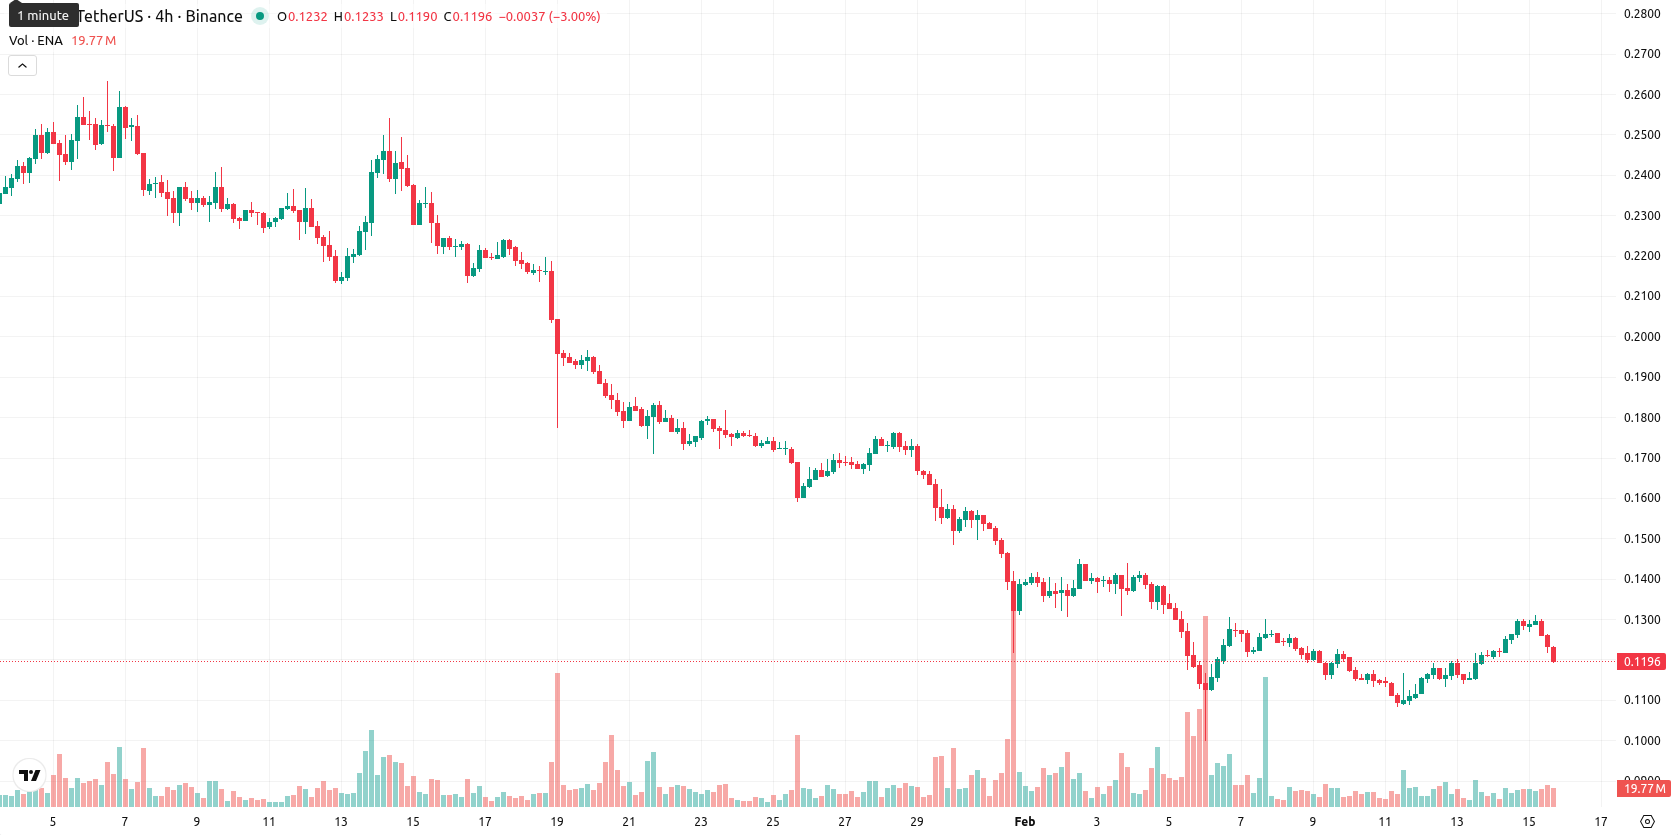
Ethena: Sellers dominate as downward signals deepen 7.08% loss

Ethena (ENA) is trading below its MA-20 ($0.1359), MA-50 ($0.1834), and MA-200 ($0.4080), signaling persistent short-, medium-, and long-term pressure from sellers. The closest dynamic resistance is the Ichimoku Kijun at $0.1474, while MA-5 and Hull Moving Average offer short-term support near the current price.
Highlights
- ENA is trading below its MA-20 ($0.1359), MA-50 ($0.1834), and MA-200 ($0.4080), indicating persistent selling pressure across all timeframes.
- Momentum remains strongly bearish, with both MACD and ADX projecting downward strength, while the RSI on D1 is at 38.8 and leans oversold.
- Expected range for the next five trading days is $0.1080–$0.1270, with a probability of an upward move below 20% and further downside likely.
Bearish momentum intensifies as price consolidates near session low
Momentum signals remain strongly bearish, with the MACD and ADX both projecting downward strength. The RSI on D1 sits at 38.8 and leans oversold, while Stochastic RSI confirms an overbought condition — highlighting a divergence, as CCI reads neutral. Bull/Bear Power is near zero but forecasts a strong buy, indicating slight buyer activity, which is inconsistent with broader momentum. The session saw no gap between the previous close and today’s open. Price is now pinned near today’s low ($0.1192 – $0.1310), reflecting high intraday volatility. The asset has dropped 7.08%, with sustained selling pressure dominating after the open, as weak momentum reinforces the downward tone.
Downward bias persists as narrow range reflects elevated downside risk
For the coming five trading days, the typical volatility band is $0.1080 to $0.1270, centered around the current level to reflect recent price swings. The probability of an upward move is very low (less than 20%), making further downside more likely. In the baseline scenario, ENA moves sideways between $0.1080 and $0.1270, while a bullish break above $0.1270 could prompt a move toward short-term resistance. In a bearish scenario, a break below $0.1080 risks a quick retest of new lows around $0.1050.
Previously it was reported that Ethena remains under sustained selling pressure, trading below key short-, medium-, and long-term moving averages, with weak momentum indicators such as the MACD, ADX, and oscillators confirming a dominant downtrend and lack of oversold exhaustion. Resistance persists at the Ichimoku Kijun and volatility bands suggest price action is likely to remain sideways to lower without a significant bullish catalyst.


Latest Ethena News


-
 Afghanistan
-
 Albania
-
 Algeria
-
 Angola
-
 Argentina
-
 Armenia
-
 Australia
-
 Austria
-
 Azerbaijan
-
 Bahamas
-
 Bahrain
-
 Bangladesh
-
 Belarus
-
 Belgium
-
 Bolivia
-
 Botswana
-
 Brazil
-
 Brunei
-
 Bulgaria
-
 Cambodia
-
 Cameroon
-
 Canada
-
 Chile
Chile
-
 China
China
-
 Colombia
-
 Congo
Congo
-
 Costa Rica
-
 Cote d'Ivoire
-
 Croatia
-
 Cuba
Cuba
-
 Cyprus
-
 Czechia
-
 DR Congo
-
 Denmark
-
 Dominican Republic
-
 Ecuador
-
 Egypt
Egypt
-
 El Salvador
-
 Estonia
-
 Eswatini
-
 Ethiopia
-
 Finland
-
 France
-
 Georgia
-
 Germany
-
 Ghana
Ghana
-
 Greece
-
 Haiti
Haiti
-
 Hong Kong
-
 Hungary
-
 India
India
-
 Indonesia
-
 Iran, Islamic republic
-
 Iraq
Iraq
-
 Ireland
-
 Israel
-
 Italy
Italy
-
 Jamaica
-
 Japan
Japan
-
 Jordan
-
 Kazakhstan
-
 Kenya
Kenya
-
 Korea
Korea
-
 Kuwait
-
 Kyrgyzstan
-
 Laos
Laos
-
 Latvia
-
 Lebanon
-
 Lesotho
-
 Libya
Libya
-
 Lithuania
-
 Luxembourg
-
 Madagascar
-
 Malaysia
-
 Malta
Malta
-
 Mauritius
-
 Mexico
-
 Moldova
-
 Mongolia
-
 Montenegro
-
 Morocco
-
 Mozambique
-
 Myanmar
-
 Namibia
-
 Nepal
Nepal
-
 Netherlands
-
 New Zealand
-
 Nigeria
-
 North Macedonia
-
 Norway
-
 Oman
Oman
-
 Pakistan
-
 Palestine
-
 Panama
-
 Papua New Guinea
-
 Paraguay
-
 Peru
Peru
-
 Philippines
-
 Poland
-
 Portugal
-
 Puerto Rico
-
 Qatar
Qatar
-
 Reunion
-
 Romania
-
 Rwanda
-
 Saudi Arabia
-
 Serbia
-
 Singapore
-
 Slovakia
-
 Slovenia
-
 Somalia
-
 South Africa
-
 Spain
Spain
-
 Sri Lanka
-
 Sweden
-
 Switzerland
-
 Syria
Syria
-
 Taiwan
-
 Tajikistan
-
 Tanzania
-
 Thailand
-
 Trinidad and Tobago
-
 Tunisia
-
 Turkey
-
 UAE
UAE
-
 Uganda
-
 Ukraine
-
 United Kingdom
-
United States
-
 Uruguay
-
 Uzbekistan
-
 Venezuela
-
 Vietnam
-
 Yemen
Yemen
-
 Zambia
-
 Zimbabwe
- Forex
- Crypto
