
PEPE declines amid lack of reversal signals as weekly RSI and oscillators remain neutral to bearish – weekly analysis

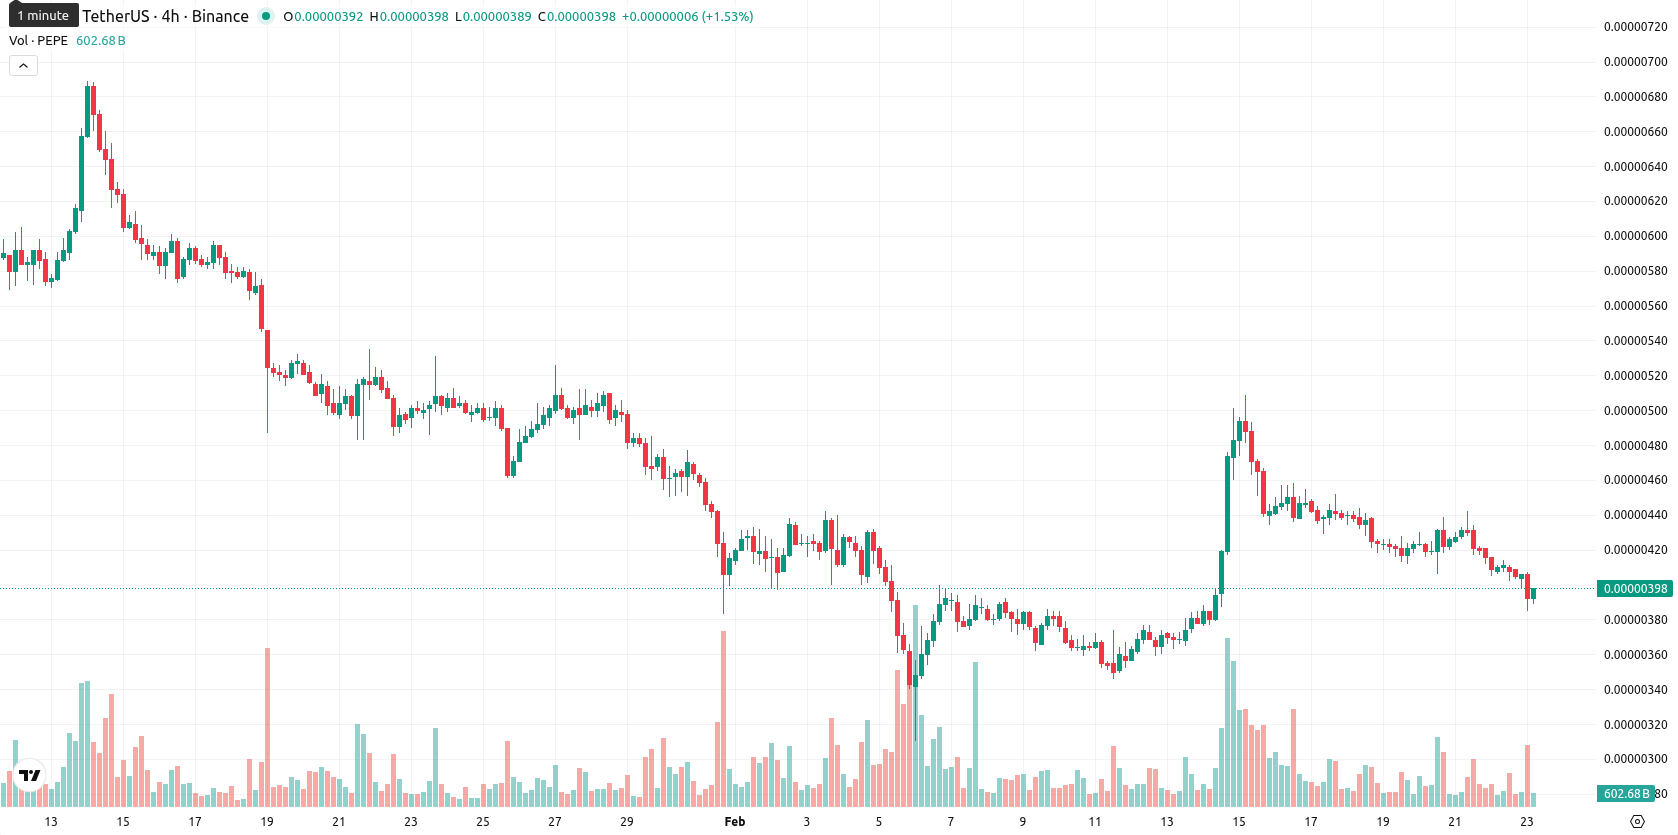
Pepe (PEPE) is currently trading at $0.0000039, reflecting a decline over the past week. The asset remains positioned below the MA-20 ($0.00000404), MA-50 ($0.00000492), and MA-200 ($0.00000686) on the W1 chart, confirming that it is under persistent downward pressure and trading beneath all key weekly moving averages.
Highlights
- PEPE trades at $0.0000039, below the MA-20, MA-50, and MA-200, indicating continued bearish pressure across all timeframes.
- Momentum indicators (MACD, ADX, RSI) confirm weak trend and seller dominance, with no positive divergence or oversold signals present.
- PEPE is expected to move between $0.00000351 and $0.00000410 over the next week, with $0.00000411 as key resistance and a bearish bias prevailing.
Development milestones bolster sentiment despite last week’s price slide
Pepe recently announced the launch of a product demo and revealed it has surpassed a presale milestone of $7.234 million. These updates highlight ongoing development and strong engagement within the Pepe ecosystem, with continued investor and community participation since its notable 2023 breakout. The news focuses on official milestones and tangible progress connected to the Pepe token.
Bearish momentum holds as weekly indicators show no reversal signals
Weekly technical analysis shows PEPE staying below the MA-20, MA-50, and MA-200, underscoring bearish sentiment in both short- and long-term trends. The Ichimoku Kijun at $0.00000411 acts as the nearest dynamic resistance, while weekly support is observed near $0.00000351 and resistance remains at $0.00000410–$0.00000411. Weekly RSI signals a bearish trend but not yet oversold, and other oscillators including Stochastic RSI and Commodity Channel Index are neutral, indicating a lack of immediate reversal signals.
Sideways or lower bias expected unless price clears key resistance
Looking ahead, PEPE is expected to trade within a narrow range of $0.00000351 to $0.00000410 over the next five to seven trading days. Based on weekly indicators, the probability of a sustained price rebound is very low, with downward or sideways movement seen as much more likely. A decisive break above $0.00000411 is required for a bullish scenario, while any weakness below $0.00000351 could open the door to further declines.
Last time, analysts noted that Pepe is trading just above its short-term moving average but remains below key medium- and long-term MAs, with technical indicators—including MACD and ADX—confirming persistent bearish momentum and weak support. Resistance at the Ichimoku Kijun limits upside potential, and the asset is expected to trade sideways within a narrow range, with any breakout above resistance unlikely in the short term.


Latest PEPE/USD News


-
 Afghanistan
-
 Albania
-
 Algeria
-
 Angola
-
 Argentina
-
 Armenia
-
 Australia
-
 Austria
-
 Azerbaijan
-
 Bahamas
-
 Bahrain
-
 Bangladesh
-
 Belarus
-
 Belgium
-
 Bolivia
-
 Botswana
-
 Brazil
-
 Brunei
-
 Bulgaria
-
 Cambodia
-
 Cameroon
-
 Canada
-
 Chile
Chile
-
 China
China
-
 Colombia
-
 Congo
Congo
-
 Costa Rica
-
 Cote d'Ivoire
-
 Croatia
-
 Cuba
Cuba
-
 Cyprus
-
 Czechia
-
 DR Congo
-
 Denmark
-
 Dominican Republic
-
 Ecuador
-
 Egypt
Egypt
-
 El Salvador
-
 Estonia
-
 Eswatini
-
 Ethiopia
-
 Finland
-
 France
-
 Georgia
-
 Germany
-
 Ghana
Ghana
-
 Greece
-
 Haiti
Haiti
-
 Hong Kong
-
 Hungary
-
 India
India
-
 Indonesia
-
 Iran, Islamic republic
-
 Iraq
Iraq
-
 Ireland
-
 Israel
-
 Italy
Italy
-
 Jamaica
-
 Japan
Japan
-
 Jordan
-
 Kazakhstan
-
 Kenya
Kenya
-
 Korea
Korea
-
 Kuwait
-
 Kyrgyzstan
-
 Laos
Laos
-
 Latvia
-
 Lebanon
-
 Lesotho
-
 Libya
Libya
-
 Lithuania
-
 Luxembourg
-
 Madagascar
-
 Malaysia
-
 Malta
Malta
-
 Mauritius
-
 Mexico
-
 Moldova
-
 Mongolia
-
 Montenegro
-
 Morocco
-
 Mozambique
-
 Myanmar
-
 Namibia
-
 Nepal
Nepal
-
 Netherlands
-
 New Zealand
-
 Nigeria
-
 North Macedonia
-
 Norway
-
 Oman
Oman
-
 Pakistan
-
 Palestine
-
 Panama
-
 Papua New Guinea
-
 Paraguay
-
 Peru
Peru
-
 Philippines
-
 Poland
-
 Portugal
-
 Puerto Rico
-
 Qatar
Qatar
-
 Reunion
-
 Romania
-
 Rwanda
-
 Saudi Arabia
-
 Serbia
-
 Singapore
-
 Slovakia
-
 Slovenia
-
 Somalia
-
 South Africa
-
 Spain
Spain
-
 Sri Lanka
-
 Sweden
-
 Switzerland
-
 Syria
Syria
-
 Taiwan
-
 Tajikistan
-
 Tanzania
-
 Thailand
-
 Trinidad and Tobago
-
 Tunisia
-
 Turkey
-
 UAE
UAE
-
 Uganda
-
 Ukraine
-
 United Kingdom
-
United States
-
 Uruguay
-
 Uzbekistan
-
 Venezuela
-
 Vietnam
-
 Yemen
Yemen
-
 Zambia
-
 Zimbabwe
- Forex
- Crypto
