
Pepe price prediction: Sideways action likely as PEPE struggles near support

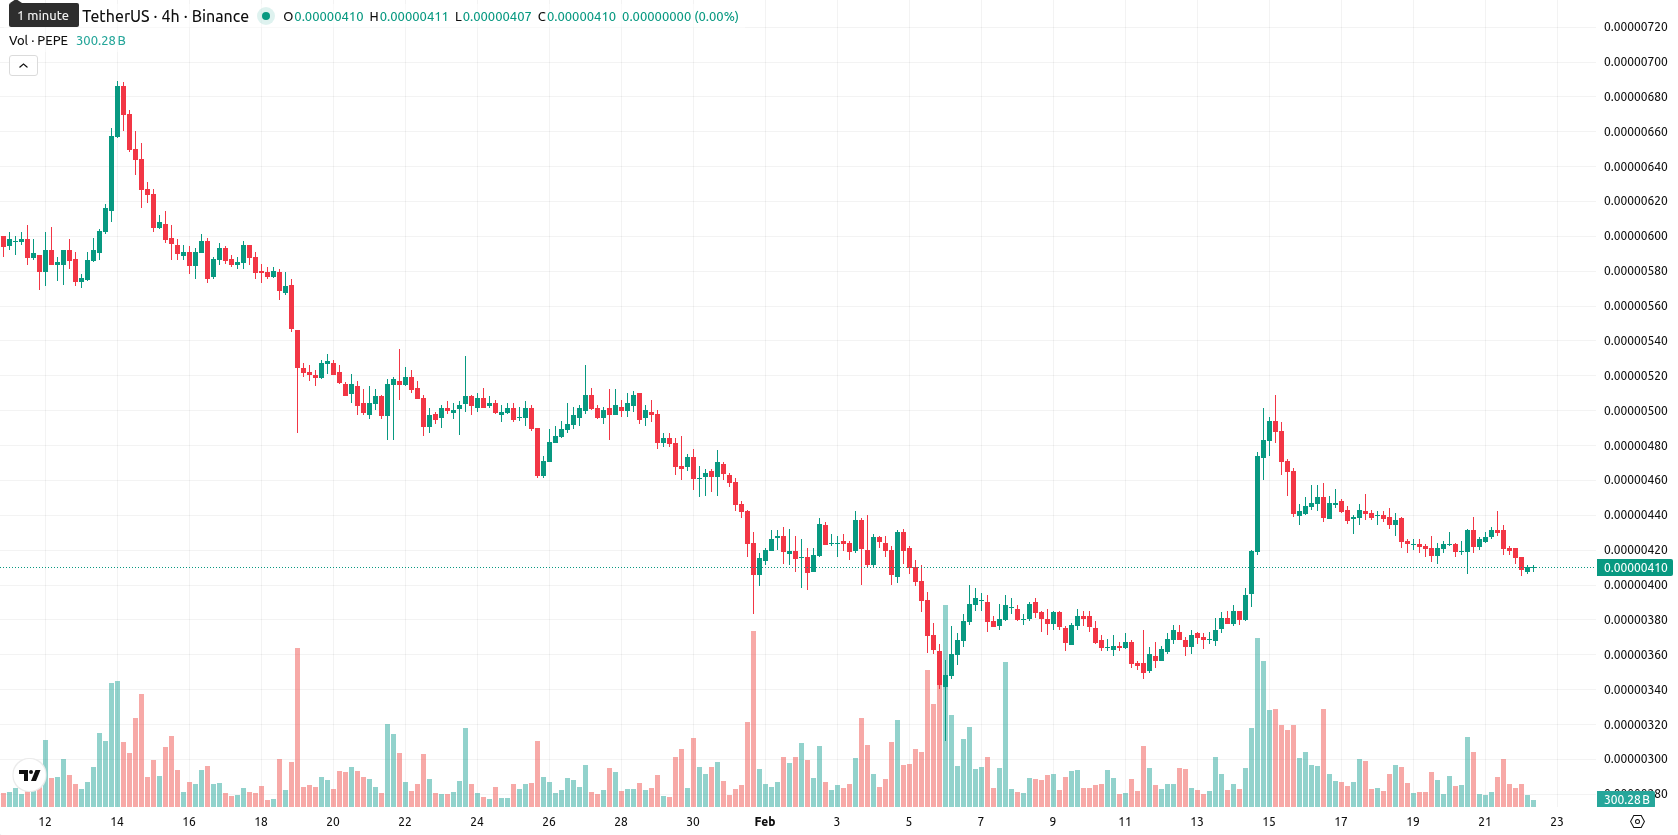
Pepe (PEPE) is trading at $0.0000041, just above the MA-20 ($0.00000405), but well below the MA-50 ($0.00000496) and MA-200 ($0.00000689). This indicates weak short-term support and persistent selling pressure over the medium and long term.
Highlights
- PEPE trades at $0.0000041, just above the MA-20 but well below the MA-50 ($0.00000496) and MA-200 ($0.00000689), indicating ongoing medium- and long-term bearish pressure.
- Momentum indicators including MACD and ADX are decisively bearish, with the probability of a price increase in the next five days below 20%.
- Immediate resistance is at $0.00000418 (Ichimoku Kijun), key support at $0.00000370, and a likely trading range of $0.00000370–$0.00000440 is projected.
Bearish momentum persists as major resistance contains price
Technically, the Ichimoku Kijun level at $0.00000418 acts as immediate resistance, sitting above the current price. Momentum remains decisively bearish, with both MACD and ADX confirming strong selling and no clear directional turn, while the RSI shows modest downside without being oversold. The Stochastic RSI and CCI are neutral, as is the Awesome Oscillator, and Bull/Bear Power indicates buyers are starting to re-emerge but are not dominant. PEPE's price is at the lower end of today's $0.0000041 – $0.0000042 range after a 7.05% fall, reflecting low volatility and ongoing pressure despite some divergence in intraday oscillators.
Sideways trading expected as resistance caps bullish probability
For the next 5 days, PEPE is likely to trade within a typical volatility band between $0.00000370 and $0.00000440, with the probability of an upward move considered very low (less than 20%). Sideways movement within this corridor is the baseline expectation. A bullish scenario would require a clear breakout above resistance at $0.00000418, while a drop below $0.00000370 would increase the risk of further downside.
Previously it was reported that Pepe trades above its short-term moving average but remains below key medium- and long-term MAs, with technical indicators signaling short-term resilience within a broader bearish trend. The asset faces strong downside momentum as sell signals persist across major oscillators, with resistance at the MA-50 and support near the Ichimoku Kijun, suggesting a continued bias toward lower levels unless a breakout above resistance occurs.


Latest PEPE/USD News


-
 Afghanistan
-
 Albania
-
 Algeria
-
 Angola
-
 Argentina
-
 Armenia
-
 Australia
-
 Austria
-
 Azerbaijan
-
 Bahamas
-
 Bahrain
-
 Bangladesh
-
 Belarus
-
 Belgium
-
 Bolivia
-
 Botswana
-
 Brazil
-
 Brunei
-
 Bulgaria
-
 Cambodia
-
 Cameroon
-
 Canada
-
 Chile
Chile
-
 China
China
-
 Colombia
-
 Congo
Congo
-
 Costa Rica
-
 Cote d'Ivoire
-
 Croatia
-
 Cuba
Cuba
-
 Cyprus
-
 Czechia
-
 DR Congo
-
 Denmark
-
 Dominican Republic
-
 Ecuador
-
 Egypt
Egypt
-
 El Salvador
-
 Estonia
-
 Eswatini
-
 Ethiopia
-
 Finland
-
 France
-
 Georgia
-
 Germany
-
 Ghana
Ghana
-
 Greece
-
 Haiti
Haiti
-
 Hong Kong
-
 Hungary
-
 India
India
-
 Indonesia
-
 Iran, Islamic republic
-
 Iraq
Iraq
-
 Ireland
-
 Israel
-
 Italy
Italy
-
 Jamaica
-
 Japan
Japan
-
 Jordan
-
 Kazakhstan
-
 Kenya
Kenya
-
 Korea
Korea
-
 Kuwait
-
 Kyrgyzstan
-
 Laos
Laos
-
 Latvia
-
 Lebanon
-
 Lesotho
-
 Libya
Libya
-
 Lithuania
-
 Luxembourg
-
 Madagascar
-
 Malaysia
-
 Malta
Malta
-
 Mauritius
-
 Mexico
-
 Moldova
-
 Mongolia
-
 Montenegro
-
 Morocco
-
 Mozambique
-
 Myanmar
-
 Namibia
-
 Nepal
Nepal
-
 Netherlands
-
 New Zealand
-
 Nigeria
-
 North Macedonia
-
 Norway
-
 Oman
Oman
-
 Pakistan
-
 Palestine
-
 Panama
-
 Papua New Guinea
-
 Paraguay
-
 Peru
Peru
-
 Philippines
-
 Poland
-
 Portugal
-
 Puerto Rico
-
 Qatar
Qatar
-
 Reunion
-
 Romania
-
 Rwanda
-
 Saudi Arabia
-
 Serbia
-
 Singapore
-
 Slovakia
-
 Slovenia
-
 Somalia
-
 South Africa
-
 Spain
Spain
-
 Sri Lanka
-
 Sweden
-
 Switzerland
-
 Syria
Syria
-
 Taiwan
-
 Tajikistan
-
 Tanzania
-
 Thailand
-
 Trinidad and Tobago
-
 Tunisia
-
 Turkey
-
 UAE
UAE
-
 Uganda
-
 Ukraine
-
 United Kingdom
-
United States
-
 Uruguay
-
 Uzbekistan
-
 Venezuela
-
 Vietnam
-
 Yemen
Yemen
-
 Zambia
-
 Zimbabwe
- Forex
- Crypto
